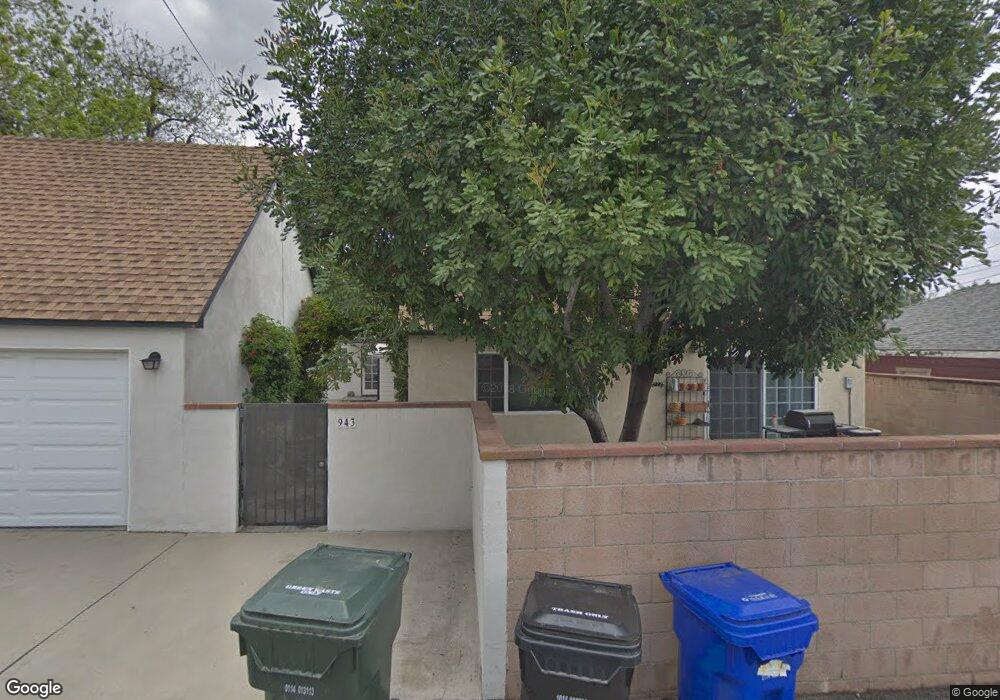
943 N 2nd Ave Upland, CA 91786
Estimated Value: $709,000 - $799,000
2
Beds
2
Baths
1,688
Sq Ft
$437/Sq Ft
Est. Value
About This Home
This home is located at 943 N 2nd Ave, Upland, CA 91786 and is currently estimated at $738,393, approximately $437 per square foot. 943 N 2nd Ave is a home located in San Bernardino County with nearby schools including Upland Elementary School, Upland Junior High School, and Upland High School.
Ownership History
Date
Name
Owned For
Owner Type
Purchase Details
Closed on
Apr 21, 2021
Sold by
Regan Kimberly
Bought by
Regan Kimberly E and Regan Living Trust
Current Estimated Value
Purchase Details
Closed on
Dec 19, 2003
Sold by
Powell Jeffrey R
Bought by
Regan James and Regan Kimberly
Home Financials for this Owner
Home Financials are based on the most recent Mortgage that was taken out on this home.
Original Mortgage
$303,200
Interest Rate
6.35%
Mortgage Type
Purchase Money Mortgage
Purchase Details
Closed on
Nov 1, 1999
Sold by
Hoover James
Bought by
Powell Jeffrey R
Home Financials for this Owner
Home Financials are based on the most recent Mortgage that was taken out on this home.
Original Mortgage
$164,250
Interest Rate
9.62%
Purchase Details
Closed on
Aug 20, 1997
Sold by
Saunders Mark B
Bought by
Saunders Paula J
Create a Home Valuation Report for This Property
The Home Valuation Report is an in-depth analysis detailing your home's value as well as a comparison with similar homes in the area
Home Values in the Area
Average Home Value in this Area
Purchase History
| Date | Buyer | Sale Price | Title Company |
|---|---|---|---|
| Regan Kimberly E | -- | None Available | |
| Regan James | $379,000 | Fidelity National Title Co | |
| Powell Jeffrey R | $185,000 | First American Title Ins Co | |
| Saunders Paula J | -- | -- |
Source: Public Records
Mortgage History
| Date | Status | Borrower | Loan Amount |
|---|---|---|---|
| Previous Owner | Regan James | $303,200 | |
| Previous Owner | Powell Jeffrey R | $164,250 |
Source: Public Records
Tax History
| Year | Tax Paid | Tax Assessment Tax Assessment Total Assessment is a certain percentage of the fair market value that is determined by local assessors to be the total taxable value of land and additions on the property. | Land | Improvement |
|---|---|---|---|---|
| 2025 | $6,334 | $578,048 | $188,602 | $389,446 |
| 2024 | $6,132 | $566,714 | $184,904 | $381,810 |
| 2023 | $6,039 | $555,602 | $181,278 | $374,324 |
| 2022 | $5,908 | $544,708 | $177,724 | $366,984 |
| 2021 | $5,900 | $534,027 | $174,239 | $359,788 |
| 2020 | $5,739 | $528,551 | $172,452 | $356,099 |
| 2019 | $5,719 | $518,188 | $169,071 | $349,117 |
| 2018 | $5,577 | $508,028 | $165,756 | $342,272 |
| 2017 | $5,277 | $485,100 | $169,800 | $315,300 |
| 2016 | $4,908 | $462,000 | $161,700 | $300,300 |
| 2015 | $4,635 | $440,000 | $154,000 | $286,000 |
| 2014 | $3,471 | $333,000 | $117,000 | $216,000 |
Source: Public Records
Map
Nearby Homes
- 1270 N Euclid Ave
- 855 N Palm Ave
- 1234 N Laurel Ave
- 910 N Redding Way Unit I
- 910 N Redding Way Unit F
- 636 N Palm Ave
- 1318 N Laurel Ave
- 509 N Euclid Ave
- 769 Valadez St
- 511 D St
- 1377 N 5th Ave
- 171 E 14th St
- 494 N Campus Ave
- 556 D St
- 478 N Campus Ave
- 762 N Vallejo Way
- 929 E Foothill Blvd Unit 91
- 929 E Foothill Blvd Unit 15
- 929 E Foothill Blvd Unit 46
- 929 E Foothill Blvd Unit 161
Your Personal Tour Guide
Ask me questions while you tour the home.