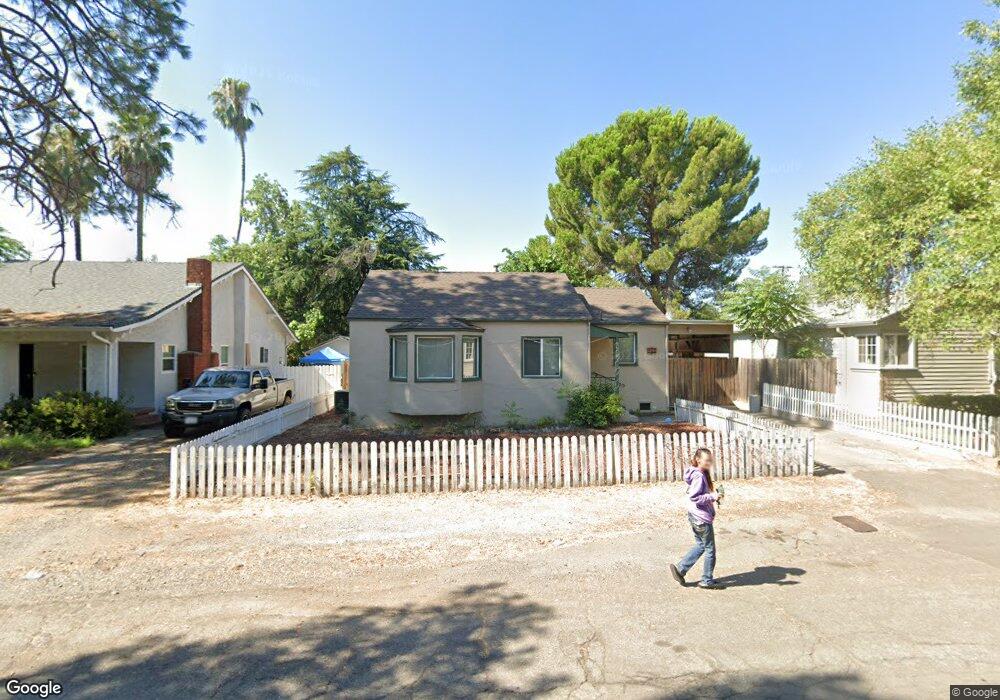
943 State St Redding, CA 96001
Parkview NeighborhoodEstimated Value: $217,000 - $253,000
3
Beds
1
Bath
978
Sq Ft
$237/Sq Ft
Est. Value
About This Home
This home is located at 943 State St, Redding, CA 96001 and is currently estimated at $231,601, approximately $236 per square foot. 943 State St is a home located in Shasta County with nearby schools including Juniper, Sequoia Middle School, and Shasta High School.
Ownership History
Date
Name
Owned For
Owner Type
Purchase Details
Closed on
Feb 29, 2012
Sold by
Blowers John Paul and Blowers Belinda Gay
Bought by
Blowers John P and Blowers Belinda G
Current Estimated Value
Purchase Details
Closed on
Dec 7, 2011
Sold by
Dearman Judith
Bought by
Blowers John Paul and Blowers Belinda Gay
Home Financials for this Owner
Home Financials are based on the most recent Mortgage that was taken out on this home.
Original Mortgage
$72,000
Outstanding Balance
$49,371
Interest Rate
4.06%
Mortgage Type
New Conventional
Estimated Equity
$182,230
Purchase Details
Closed on
Feb 6, 2007
Sold by
Haskell Robert and Haskell Michael J
Bought by
Dearman Judith
Purchase Details
Closed on
Feb 23, 2006
Sold by
Haskell Robert
Bought by
Haskell Robert and Haskell Micheal J
Purchase Details
Closed on
May 20, 1998
Sold by
Redding Redevelopment Agency
Bought by
Haskell Robert Stephen
Create a Home Valuation Report for This Property
The Home Valuation Report is an in-depth analysis detailing your home's value as well as a comparison with similar homes in the area
Home Values in the Area
Average Home Value in this Area
Purchase History
| Date | Buyer | Sale Price | Title Company |
|---|---|---|---|
| Blowers John P | -- | None Available | |
| Blowers John Paul | $90,000 | Fidelity Natl Title Co Of Ca | |
| Dearman Judith | $169,000 | First American Title Company | |
| Haskell Robert | -- | None Available | |
| Haskell Robert Stephen | $32,000 | First American Title Co |
Source: Public Records
Mortgage History
| Date | Status | Borrower | Loan Amount |
|---|---|---|---|
| Open | Blowers John Paul | $72,000 |
Source: Public Records
Tax History
| Year | Tax Paid | Tax Assessment Tax Assessment Total Assessment is a certain percentage of the fair market value that is determined by local assessors to be the total taxable value of land and additions on the property. | Land | Improvement |
|---|---|---|---|---|
| 2025 | $1,197 | $113,031 | $31,394 | $81,637 |
| 2024 | $1,178 | $110,816 | $30,779 | $80,037 |
| 2023 | $1,178 | $108,644 | $30,176 | $78,468 |
| 2022 | $1,158 | $106,515 | $29,585 | $76,930 |
| 2021 | $1,151 | $104,427 | $29,005 | $75,422 |
| 2020 | $1,166 | $103,357 | $28,708 | $74,649 |
| 2019 | $1,108 | $101,332 | $28,146 | $73,186 |
| 2018 | $1,117 | $99,346 | $27,595 | $71,751 |
| 2017 | $1,111 | $97,399 | $27,054 | $70,345 |
| 2016 | $1,076 | $95,490 | $26,524 | $68,966 |
| 2015 | $1,062 | $94,057 | $26,126 | $67,931 |
| 2014 | $1,055 | $92,216 | $25,615 | $66,601 |
Source: Public Records
Map
Nearby Homes
- 1012 State St
- 864 Kite Ln
- 745 Parkview Ave
- 2514 California St
- 2405 Cliff Dr
- 815 Locust St
- 351 Weldon St
- 3244 Veda St
- 2123 Waldon St
- 2239 Garden Ave
- 3443 West St
- 1005 Gold St
- 2590 Henderson Rd
- 2056 Canal Dr
- 350 Park Marina Cir
- 1868 Gold St
- 2050 Skyline Dr
- 0 California St Unit 25-5331
- 649 Lowe St
- 2077 Skyline Dr
Your Personal Tour Guide
Ask me questions while you tour the home.