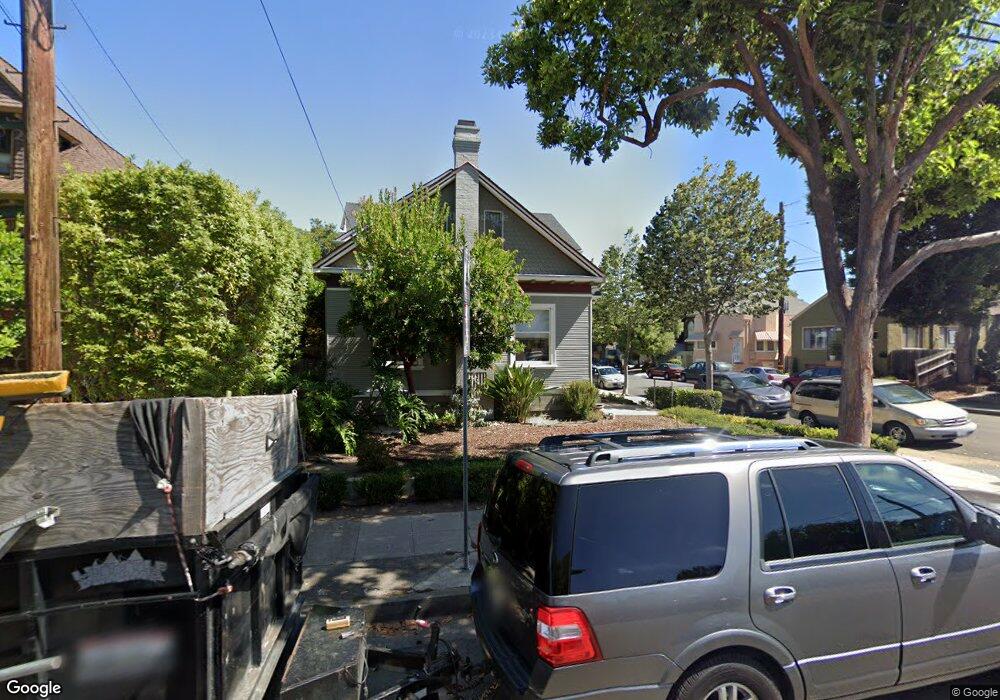
943 Taylor Ave Alameda, CA 94501
West Alameda NeighborhoodEstimated Value: $1,225,000 - $1,621,798
5
Beds
2
Baths
3,268
Sq Ft
$421/Sq Ft
Est. Value
About This Home
This home is located at 943 Taylor Ave, Alameda, CA 94501 and is currently estimated at $1,376,700, approximately $421 per square foot. 943 Taylor Ave is a home located in Alameda County with nearby schools including Maya Lin School, Encinal Junior/Senior High, and Will C. Wood Middle School.
Ownership History
Date
Name
Owned For
Owner Type
Purchase Details
Closed on
Aug 26, 2025
Sold by
Tobase Zimmerman and Tobase Patricia
Bought by
Tobase Zimmerman Family Trust and Tobase
Current Estimated Value
Purchase Details
Closed on
Jan 24, 2007
Sold by
Patricia Zimmerman Kevin and Patricia Lobase
Bought by
Zimmerman Kevin and Zimmerman Patricia Lobase
Home Financials for this Owner
Home Financials are based on the most recent Mortgage that was taken out on this home.
Original Mortgage
$815,000
Interest Rate
6.37%
Mortgage Type
New Conventional
Purchase Details
Closed on
Jul 11, 2002
Sold by
Crist Mary Agnes and Louis & Antonia Espinoza Trust
Bought by
Zimmerman Kevin and Tobase Patricia
Home Financials for this Owner
Home Financials are based on the most recent Mortgage that was taken out on this home.
Original Mortgage
$300,700
Interest Rate
6.69%
Purchase Details
Closed on
Oct 14, 1997
Sold by
Espinoza Louis and Espinoza A
Bought by
Louis & Antonia Espinoza Trust
Create a Home Valuation Report for This Property
The Home Valuation Report is an in-depth analysis detailing your home's value as well as a comparison with similar homes in the area
Home Values in the Area
Average Home Value in this Area
Purchase History
| Date | Buyer | Sale Price | Title Company |
|---|---|---|---|
| Tobase Zimmerman Family Trust | -- | None Listed On Document | |
| Zimmerman Kevin | -- | Alliance Title Company | |
| Zimmerman Kevin | $399,000 | North American Title Co | |
| Louis & Antonia Espinoza Trust | -- | -- |
Source: Public Records
Mortgage History
| Date | Status | Borrower | Loan Amount |
|---|---|---|---|
| Previous Owner | Zimmerman Kevin | $815,000 | |
| Previous Owner | Zimmerman Kevin | $300,700 | |
| Closed | Zimmerman Kevin | $78,350 |
Source: Public Records
Tax History
| Year | Tax Paid | Tax Assessment Tax Assessment Total Assessment is a certain percentage of the fair market value that is determined by local assessors to be the total taxable value of land and additions on the property. | Land | Improvement |
|---|---|---|---|---|
| 2025 | $12,665 | $798,576 | $173,349 | $632,227 |
| 2024 | $12,665 | $782,785 | $169,951 | $619,834 |
| 2023 | $12,215 | $774,303 | $166,620 | $607,683 |
| 2022 | $11,960 | $752,124 | $163,353 | $595,771 |
| 2021 | $11,688 | $737,243 | $160,151 | $584,092 |
| 2020 | $11,556 | $736,615 | $158,510 | $578,105 |
| 2019 | $10,572 | $722,175 | $155,402 | $566,773 |
| 2018 | $10,317 | $708,019 | $152,356 | $555,663 |
| 2017 | $9,864 | $694,141 | $149,370 | $544,771 |
| 2016 | $9,876 | $680,534 | $146,442 | $534,092 |
| 2015 | $9,844 | $670,316 | $144,243 | $526,073 |
| 2014 | $9,367 | $657,188 | $141,418 | $515,770 |
Source: Public Records
Map
Nearby Homes
- 1000 Central Ave
- 911 Taylor Ave
- 1512 Mozart St
- 1523 Verdi St
- 1220 9th St
- 1427 Bay St
- 1211 Santa Clara Ave
- 1203 Benton St
- 1500 Alameda Ave Unit G
- 1606 Morton St
- 1305 Webster St Unit C309
- 1305 Webster St Unit C102
- 1401 Cottage St Unit D
- 1211 Paru St
- 1333 Webster St Unit A107
- 1321 Webster St Unit D119
- 1321 Webster St Unit D116
- 1327 Webster St Unit B210
- 1327 Webster St Unit B101
- 2180 Barnes Wharf Ln
- 939 Taylor Ave
- 935 Taylor Ave
- 1442 Caroline St
- 1444 Caroline St
- 1440 Caroline St
- 950 Santa Clara Ave
- 1423 Caroline St Unit C
- 1423 Caroline St
- 933 Taylor Ave
- 946 Santa Clara Ave
- 1007 Taylor Ave
- 944 Santa Clara Ave
- 1448 Caroline St
- 931 Taylor Ave
- 940 Santa Clara Ave
- 1421 Caroline St
- 1454 Caroline St
- 1002 Taylor Ave
- 1011 Taylor Ave
- 938 Santa Clara Ave
Your Personal Tour Guide
Ask me questions while you tour the home.