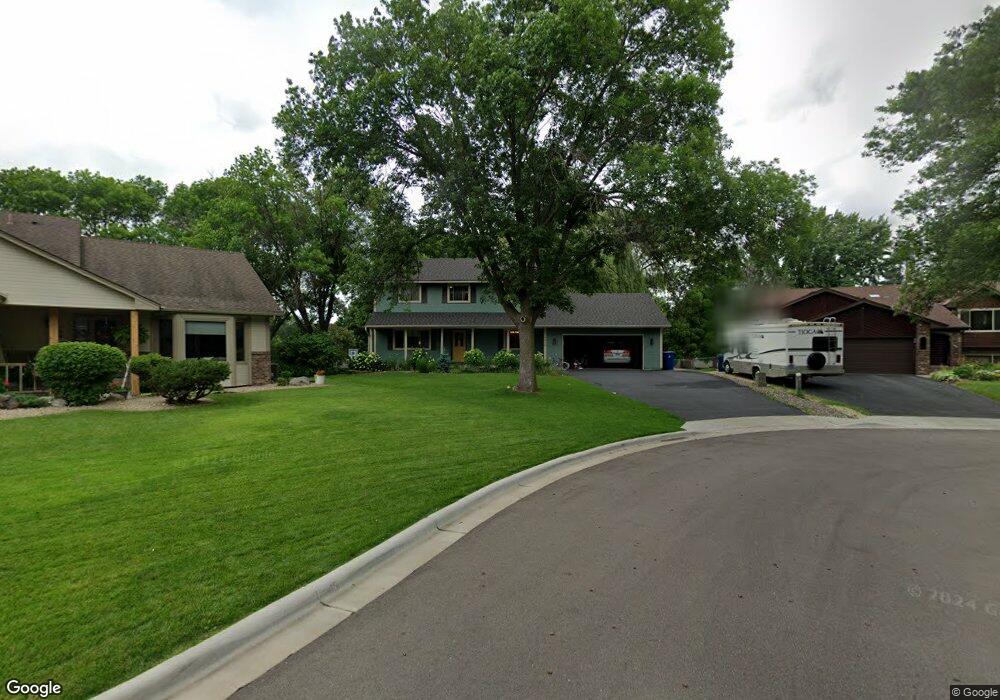
9433 Parkside Ct Champlin, MN 55316
Estimated Value: $397,000 - $496,000
4
Beds
4
Baths
3,196
Sq Ft
$143/Sq Ft
Est. Value
About This Home
This home is located at 9433 Parkside Ct, Champlin, MN 55316 and is currently estimated at $457,043, approximately $143 per square foot. 9433 Parkside Ct is a home located in Hennepin County with nearby schools including Dayton Elementary School, Jackson Middle School, and Champlin Park High School.
Ownership History
Date
Name
Owned For
Owner Type
Purchase Details
Closed on
May 30, 2019
Sold by
Boniface Gaetano R and Boniface Debora
Bought by
Callan James and Callan Rachel M
Current Estimated Value
Home Financials for this Owner
Home Financials are based on the most recent Mortgage that was taken out on this home.
Original Mortgage
$306,850
Outstanding Balance
$269,796
Interest Rate
4.1%
Mortgage Type
New Conventional
Estimated Equity
$187,247
Purchase Details
Closed on
Oct 19, 2017
Sold by
Lindquist Jill R and Lindquist Steven R
Bought by
Boniface Gaetano R and Boniface Deborah
Home Financials for this Owner
Home Financials are based on the most recent Mortgage that was taken out on this home.
Original Mortgage
$208,587
Interest Rate
3.62%
Mortgage Type
FHA
Create a Home Valuation Report for This Property
The Home Valuation Report is an in-depth analysis detailing your home's value as well as a comparison with similar homes in the area
Home Values in the Area
Average Home Value in this Area
Purchase History
| Date | Buyer | Sale Price | Title Company |
|---|---|---|---|
| Callan James | $323,000 | Multiple | |
| Boniface Gaetano R | $315,000 | Land Title Inc |
Source: Public Records
Mortgage History
| Date | Status | Borrower | Loan Amount |
|---|---|---|---|
| Open | Callan James | $306,850 | |
| Previous Owner | Boniface Gaetano R | $208,587 |
Source: Public Records
Tax History
| Year | Tax Paid | Tax Assessment Tax Assessment Total Assessment is a certain percentage of the fair market value that is determined by local assessors to be the total taxable value of land and additions on the property. | Land | Improvement |
|---|---|---|---|---|
| 2024 | $6,150 | $427,200 | $100,800 | $326,400 |
| 2023 | $6,116 | $432,000 | $100,800 | $331,200 |
| 2022 | $4,265 | $409,000 | $94,000 | $315,000 |
| 2021 | $4,009 | $343,000 | $81,000 | $262,000 |
| 2020 | $4,065 | $323,000 | $71,000 | $252,000 |
| 2019 | $3,981 | $319,000 | $77,000 | $242,000 |
| 2018 | $3,407 | $300,000 | $58,000 | $242,000 |
| 2017 | $3,269 | $251,000 | $55,000 | $196,000 |
| 2016 | $3,397 | $251,000 | $68,000 | $183,000 |
| 2015 | $3,282 | $243,000 | $60,000 | $183,000 |
| 2014 | -- | $224,000 | $57,000 | $167,000 |
Source: Public Records
Map
Nearby Homes
- 11404 Rosemill Ct
- 11647 Magnolia Ct N
- 11547 Elmwood Ave N Unit 55
- 11209 Independence Ave N
- 10500 Chestnut Cir N
- 11477 Marketplace Dr N
- 8458 S Pond Trail Unit 26
- 11505 Basswood Ln N
- 9969 108th Place N
- 11916 Emery Village Dr N
- 10029 108th Place N
- 11800 Emery Village Dr N
- 11466 Preserve Ln N
- 11509 Winnetka Ave N
- 10304 107th Place N
- 7809 119th Ave N
- 7710 118th Ave N
- 11229 Quebec Ave N
- 7606 116th Ave N
- 8020 122nd Ln N
- 9427 Parkside Ct
- 9437 Parkside Ct
- 9686 Parkside Trail
- 9680 Parkside Trail
- 9534 Parkside Trail
- 9538 Parkside Trail
- 9423 Parkside Ct
- 9528 Parkside Trail
- 9692 Parkside Trail
- 9544 Parkside Trail
- 9419 Parkside Ct
- 9674 Parkside Trail
- 9426 Parkside Ct
- 9438 Parkside Ct
- 9522 Parkside Trail
- 9432 Parkside Ct
- 9550 Parkside Trail
- 9415 Parkside Ct
- 9670 Parkside Trail
- 9537 Parkside Trail
Your Personal Tour Guide
Ask me questions while you tour the home.