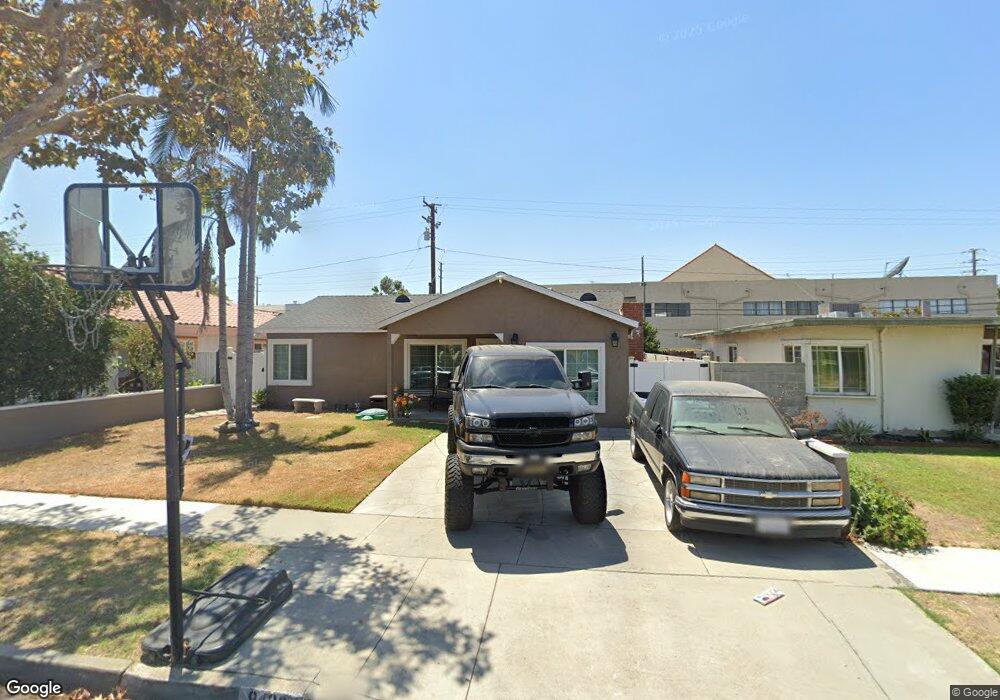
9436 Claymore St Pico Rivera, CA 90660
Estimated Value: $717,529 - $775,000
3
Beds
2
Baths
1,315
Sq Ft
$573/Sq Ft
Est. Value
About This Home
This home is located at 9436 Claymore St, Pico Rivera, CA 90660 and is currently estimated at $753,632, approximately $573 per square foot. 9436 Claymore St is a home located in Los Angeles County with nearby schools including Birney Tech Academy, The STEAM Academy @ Burke, and El Rancho High School.
Ownership History
Date
Name
Owned For
Owner Type
Purchase Details
Closed on
May 20, 2018
Sold by
Hernandez Ruben
Bought by
Hernandez Ruben and Hernandez Concepcion G
Current Estimated Value
Purchase Details
Closed on
Oct 31, 1996
Sold by
Wilmington Trust Company
Bought by
Hernandez Ruben
Home Financials for this Owner
Home Financials are based on the most recent Mortgage that was taken out on this home.
Original Mortgage
$136,452
Outstanding Balance
$13,199
Interest Rate
7.88%
Mortgage Type
FHA
Estimated Equity
$740,433
Purchase Details
Closed on
May 3, 1996
Sold by
Great Western Bank Fsb
Bought by
Wilmington Trust Company and Reo Property Trust 1996
Purchase Details
Closed on
Mar 6, 1996
Sold by
Cortez Felipe C and Cortez Martha
Bought by
Great Western Bank Fsb
Create a Home Valuation Report for This Property
The Home Valuation Report is an in-depth analysis detailing your home's value as well as a comparison with similar homes in the area
Home Values in the Area
Average Home Value in this Area
Purchase History
| Date | Buyer | Sale Price | Title Company |
|---|---|---|---|
| Hernandez Ruben | -- | None Available | |
| Hernandez Ruben | $139,000 | Fidelity National Title | |
| Wilmington Trust Company | -- | Fidelity National Title | |
| Great Western Bank Fsb | $91,000 | Chicago Title Co |
Source: Public Records
Mortgage History
| Date | Status | Borrower | Loan Amount |
|---|---|---|---|
| Open | Hernandez Ruben | $136,452 |
Source: Public Records
Tax History
| Year | Tax Paid | Tax Assessment Tax Assessment Total Assessment is a certain percentage of the fair market value that is determined by local assessors to be the total taxable value of land and additions on the property. | Land | Improvement |
|---|---|---|---|---|
| 2025 | $3,718 | $239,391 | $136,797 | $102,594 |
| 2024 | $3,718 | $234,698 | $134,115 | $100,583 |
| 2023 | $3,616 | $230,097 | $131,486 | $98,611 |
| 2022 | $3,456 | $225,586 | $128,908 | $96,678 |
| 2021 | $3,348 | $221,164 | $126,381 | $94,783 |
| 2019 | $3,318 | $214,607 | $122,634 | $91,973 |
| 2018 | $3,122 | $210,400 | $120,230 | $90,170 |
| 2016 | $2,823 | $202,231 | $115,562 | $86,669 |
| 2015 | $2,781 | $199,195 | $113,827 | $85,368 |
| 2014 | $2,750 | $195,294 | $111,598 | $83,696 |
Source: Public Records
Map
Nearby Homes
- 8611 Eglise Ave
- 8551 Eglise Ave
- 9602 Florpark St
- 9225 Sideview Dr
- 8328 Buhman Ave
- 8901 Serapis Ave Unit 25
- 9734 Terradell St
- 8320 Orange Ave
- 9017 Arrington Ave
- 8414 Cravell Ave
- 9440 Gallatin Rd
- 9434 Pico Vista Rd
- 9145 Raviller Dr
- 9069 Gallatin Rd
- 9515 Shade Ln
- 9943 Cedardale Dr
- 9378 Suva St
- 9950 La Docena Ln
- 9910 Aspen Cir
- 8604 Whittle Ct
- 9432 Claymore St
- 9442 Claymore St
- 9426 Claymore St
- 8707 Cord Ave
- 9422 Claymore St
- 9437 Claymore St
- 9429 Claymore St
- 9445 Claymore St
- 9416 Claymore St
- 9460 Claymore St
- 8634 Eglise Ave
- 8633 Cord Ave
- 9457 Claymore St
- 9412 Claymore St
- 9425 Telegraph Rd
- 9425 Telegraph Rd Unit 119
- 9425 Telegraph Rd Unit 9
- 9425 Telegraph Rd
- 9419 Claymore St
- 9464 Claymore St
Your Personal Tour Guide
Ask me questions while you tour the home.