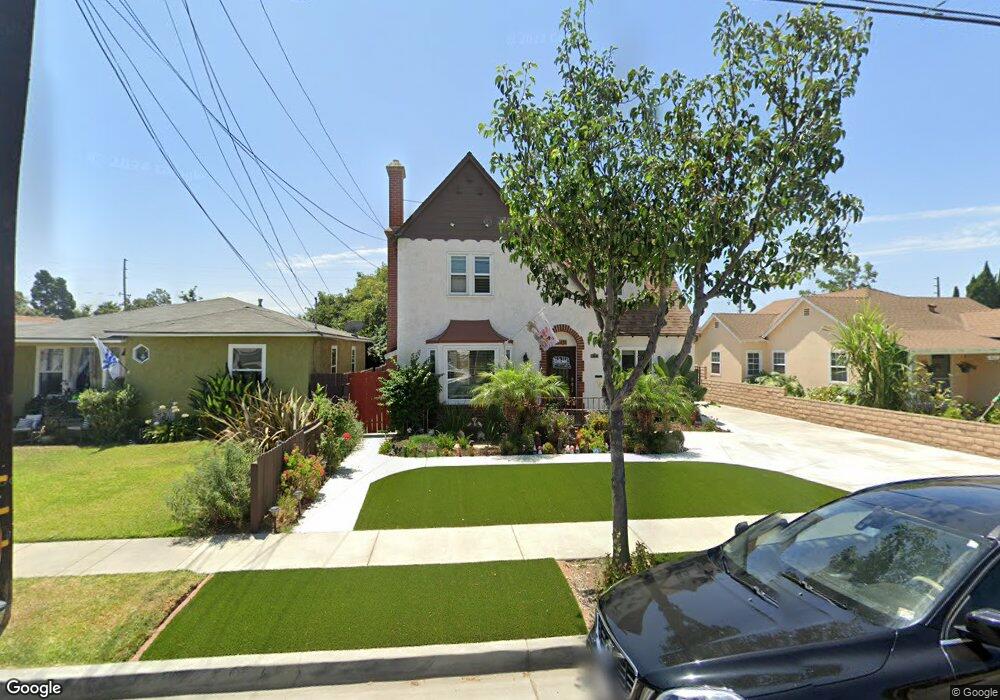
9436 Maple St Bellflower, CA 90706
Estimated Value: $861,000 - $895,000
5
Beds
2
Baths
1,914
Sq Ft
$455/Sq Ft
Est. Value
About This Home
This home is located at 9436 Maple St, Bellflower, CA 90706 and is currently estimated at $870,502, approximately $454 per square foot. 9436 Maple St is a home located in Los Angeles County with nearby schools including Ramona Elementary School, Bellflower High School, and St. Bernard School.
Ownership History
Date
Name
Owned For
Owner Type
Purchase Details
Closed on
Oct 4, 2011
Sold by
Johnson Rieko
Bought by
Johnson Gregory
Current Estimated Value
Home Financials for this Owner
Home Financials are based on the most recent Mortgage that was taken out on this home.
Original Mortgage
$296,400
Outstanding Balance
$201,277
Interest Rate
4.01%
Mortgage Type
New Conventional
Estimated Equity
$669,225
Purchase Details
Closed on
Mar 13, 1996
Sold by
Flores Alfredo G and Flores Mary Ann Masotto
Bought by
Flores Arcadio A
Home Financials for this Owner
Home Financials are based on the most recent Mortgage that was taken out on this home.
Original Mortgage
$207,999
Interest Rate
7.71%
Purchase Details
Closed on
Jan 26, 1996
Sold by
Masotto Flores Mary Ann
Bought by
Flores Alfredo G and Flores Mary Ann M
Home Financials for this Owner
Home Financials are based on the most recent Mortgage that was taken out on this home.
Original Mortgage
$207,999
Interest Rate
7.71%
Purchase Details
Closed on
Dec 14, 1995
Sold by
Flores Alfredo G
Bought by
Flores Alfredo G and Flores Mary Ann M
Create a Home Valuation Report for This Property
The Home Valuation Report is an in-depth analysis detailing your home's value as well as a comparison with similar homes in the area
Home Values in the Area
Average Home Value in this Area
Purchase History
| Date | Buyer | Sale Price | Title Company |
|---|---|---|---|
| Johnson Gregory | -- | Old Republic Title Company | |
| Johnson Gregory | $312,000 | Old Republic Title Company | |
| Flores Arcadio A | -- | Fidelity National Title | |
| Flores Alfredo G | -- | Fidelity Title | |
| Flores Alfredo G | -- | Fidelity Title |
Source: Public Records
Mortgage History
| Date | Status | Borrower | Loan Amount |
|---|---|---|---|
| Open | Johnson Gregory | $296,400 | |
| Closed | Johnson Gregory | $53,040 | |
| Previous Owner | Flores Arcadio A | $207,999 |
Source: Public Records
Tax History
| Year | Tax Paid | Tax Assessment Tax Assessment Total Assessment is a certain percentage of the fair market value that is determined by local assessors to be the total taxable value of land and additions on the property. | Land | Improvement |
|---|---|---|---|---|
| 2025 | $4,933 | $391,873 | $249,947 | $141,926 |
| 2024 | $4,933 | $384,191 | $245,047 | $139,144 |
| 2023 | $4,741 | $376,659 | $240,243 | $136,416 |
| 2022 | $4,656 | $369,275 | $235,533 | $133,742 |
| 2021 | $4,556 | $362,035 | $230,915 | $131,120 |
| 2019 | $4,439 | $351,299 | $224,067 | $127,232 |
| 2018 | $4,256 | $344,412 | $219,674 | $124,738 |
| 2016 | $4,075 | $331,041 | $211,145 | $119,896 |
| 2015 | $3,991 | $326,070 | $207,974 | $118,096 |
| 2014 | $3,940 | $319,684 | $203,901 | $115,783 |
Source: Public Records
Map
Nearby Homes
- 17046 Clark Ave
- 9545 Flower St
- 16919 Ardmore Ave
- 9559 Flower St
- 16822 Ardmore Ave
- 9520 Mayne St
- 16401 Clark Ave
- 16713 Virginia Ave
- 9601 Mayne St
- 9240 Palm St
- 9235 Artesia Blvd Unit 5
- 9200 Palm St Unit 6
- 9548 Alondra Blvd
- 8858 Flower St
- 9133 Ramona St Unit 2
- 17458 Deerfield Ave
- 17100 Apple Ave
- 9929 Park St
- 9339 Alondra Blvd Unit 2
- 9921 Flora Vista St Unit 5
Your Personal Tour Guide
Ask me questions while you tour the home.