9436 Questa Pointe San Diego, CA 92126
Mira Mesa NeighborhoodEstimated Value: $1,156,206 - $1,503,000
5
Beds
3
Baths
2,322
Sq Ft
$561/Sq Ft
Est. Value
About This Home
This home is located at 9436 Questa Pointe, San Diego, CA 92126 and is currently estimated at $1,302,052, approximately $560 per square foot. 9436 Questa Pointe is a home located in San Diego County with nearby schools including Hage Elementary School, Wangenheim Middle School, and Mira Mesa High School.
Ownership History
Date
Name
Owned For
Owner Type
Purchase Details
Closed on
Oct 12, 2018
Sold by
Shen Shyan Bob and Chang Hsiao Jung
Bought by
Shen Shyan Bob and Chang Hsiaojung
Current Estimated Value
Purchase Details
Closed on
May 31, 2011
Sold by
Truong Chanh M and Truong Hoa
Bought by
Shen Shyan Bob and Chang Hsiao Jung
Home Financials for this Owner
Home Financials are based on the most recent Mortgage that was taken out on this home.
Original Mortgage
$366,750
Outstanding Balance
$251,997
Interest Rate
4.56%
Mortgage Type
New Conventional
Estimated Equity
$1,050,055
Purchase Details
Closed on
Aug 20, 2002
Sold by
Banh Janette Man
Bought by
Truong Chanh M and Truong Hoa
Home Financials for this Owner
Home Financials are based on the most recent Mortgage that was taken out on this home.
Original Mortgage
$180,000
Interest Rate
5.69%
Mortgage Type
Purchase Money Mortgage
Purchase Details
Closed on
Oct 2, 2000
Sold by
Pardee Construction Company
Bought by
Banh Janette Man
Home Financials for this Owner
Home Financials are based on the most recent Mortgage that was taken out on this home.
Original Mortgage
$320,982
Interest Rate
7.96%
Mortgage Type
Stand Alone First
Create a Home Valuation Report for This Property
The Home Valuation Report is an in-depth analysis detailing your home's value as well as a comparison with similar homes in the area
Home Values in the Area
Average Home Value in this Area
Purchase History
| Date | Buyer | Sale Price | Title Company |
|---|---|---|---|
| Shen Shyan Bob | -- | None Available | |
| Shen Shyan Bob | $489,000 | Chicago Title | |
| Truong Chanh M | $440,000 | Southland Title | |
| Banh Janette Man | $224,500 | First American Title |
Source: Public Records
Mortgage History
| Date | Status | Borrower | Loan Amount |
|---|---|---|---|
| Open | Shen Shyan Bob | $366,750 | |
| Previous Owner | Truong Chanh M | $180,000 | |
| Previous Owner | Banh Janette Man | $320,982 |
Source: Public Records
Tax History Compared to Growth
Tax History
| Year | Tax Paid | Tax Assessment Tax Assessment Total Assessment is a certain percentage of the fair market value that is determined by local assessors to be the total taxable value of land and additions on the property. | Land | Improvement |
|---|---|---|---|---|
| 2025 | $7,644 | $626,483 | $357,096 | $269,387 |
| 2024 | $7,644 | $614,200 | $350,095 | $264,105 |
| 2023 | $7,470 | $602,158 | $343,231 | $258,927 |
| 2022 | $7,264 | $590,351 | $336,501 | $253,850 |
| 2021 | $7,206 | $578,776 | $329,903 | $248,873 |
| 2020 | $7,117 | $572,843 | $326,521 | $246,322 |
| 2019 | $6,984 | $561,612 | $320,119 | $241,493 |
| 2018 | $6,553 | $550,601 | $313,843 | $236,758 |
| 2017 | $6,447 | $539,806 | $307,690 | $232,116 |
| 2016 | $6,346 | $529,222 | $301,657 | $227,565 |
| 2015 | $6,254 | $521,273 | $297,126 | $224,147 |
| 2014 | $6,490 | $511,063 | $291,306 | $219,757 |
Source: Public Records
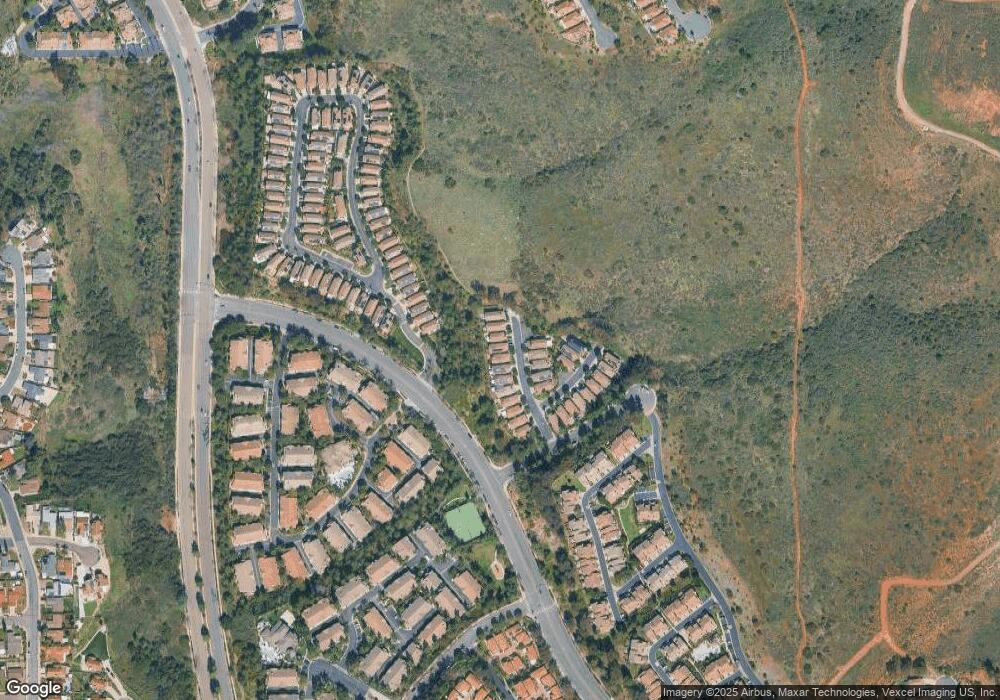
Map
Nearby Homes
- 11799 Westview Pkwy
- 11940 Black Mountain Rd Unit 41
- 9368 Babauta Rd Unit 93
- 11394 Pegasus Ave
- 9378 Chabola Rd
- 9471 Compass Point Dr S
- 11279 Pegasus Ave
- 9432 Hito Ct
- 11091 Ice Skate Place Unit 20
- 9970 Scripps Vista Way Unit 105
- 9960 Scripps Vista Way Unit 116
- 9819 Kika Ct
- 11482 Cortina Place
- 11416 Osoyoos Place
- 11368 Squamish Rd
- 8761 Menkar Rd
- 11377 Volans St
- 9310 Galvin Ave Unit 15
- 11365 Affinity Ct Unit 192
- 11325 Affinity Ct Unit 151
- 9482 Questa Pointe Unit 29
- 9478 Questa Pointe
- 9422 Questa Pointe
- 9464 Questa Pointe
- 9468 Questa Pointe
- 9472 Questa Pointe
- 9476 Questa Pointe Unit 3
- 9484 Questa Pointe
- 9474 Questa Pointe
- 9444 Questa Pointe
- 9440 Questa Pointe
- 9428 Questa Pointe
- 9480 Questa Pointe
- 9426 Questa Pointe
- 9430 Questa Pointe
- 9448 Questa Pointe
- 9432 Questa Pointe
- 9460 Questa Pointe
- 9434 Questa Pointe Unit 22
- 9440 Questa