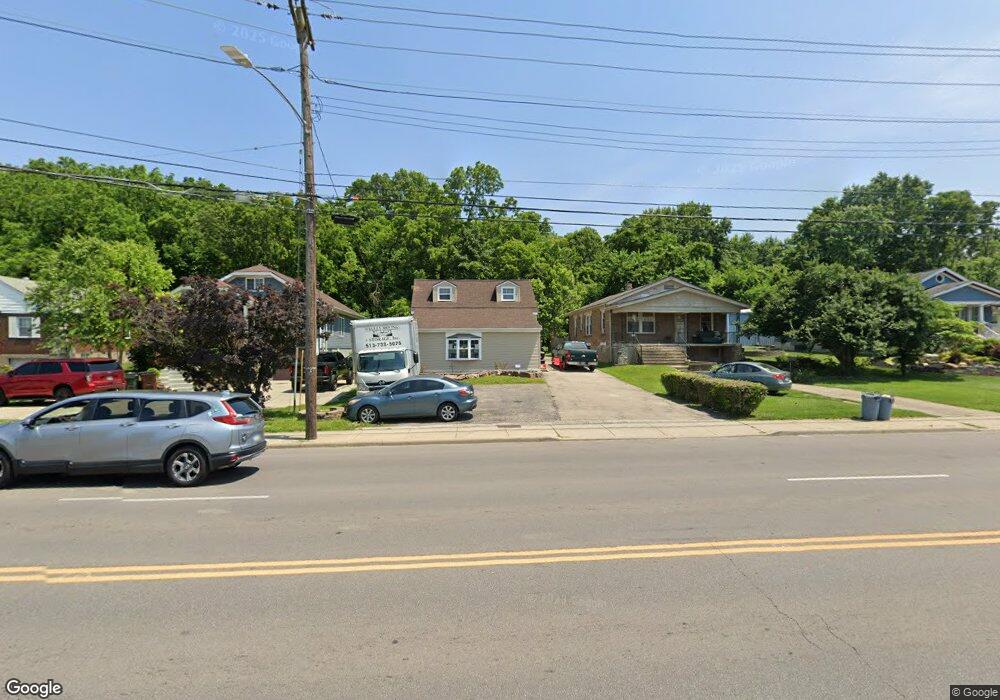
9436 Reading Rd Cincinnati, OH 45215
Estimated Value: $179,771 - $280,000
4
Beds
1
Bath
1,308
Sq Ft
$176/Sq Ft
Est. Value
About This Home
This home is located at 9436 Reading Rd, Cincinnati, OH 45215 and is currently estimated at $230,693, approximately $176 per square foot. 9436 Reading Rd is a home located in Hamilton County with nearby schools including Reading Community High School, Saints Peter and Paul Academy, and Mount Notre Dame High School.
Ownership History
Date
Name
Owned For
Owner Type
Purchase Details
Closed on
Oct 26, 2017
Sold by
Johnston David A and Johnston Alice C
Bought by
Johnston Adam G
Current Estimated Value
Purchase Details
Closed on
Jul 27, 2008
Sold by
Perkins & Marie Callenders Inc
Bought by
Southland Properties Llc
Purchase Details
Closed on
Feb 1, 2000
Sold by
Sue Geraci
Bought by
Johnston David A and Johnston Alice C
Home Financials for this Owner
Home Financials are based on the most recent Mortgage that was taken out on this home.
Original Mortgage
$88,000
Interest Rate
8.08%
Purchase Details
Closed on
Jan 10, 1997
Sold by
Redwine William H
Bought by
Geraci Sue
Home Financials for this Owner
Home Financials are based on the most recent Mortgage that was taken out on this home.
Original Mortgage
$74,000
Interest Rate
7.58%
Create a Home Valuation Report for This Property
The Home Valuation Report is an in-depth analysis detailing your home's value as well as a comparison with similar homes in the area
Home Values in the Area
Average Home Value in this Area
Purchase History
| Date | Buyer | Sale Price | Title Company |
|---|---|---|---|
| Johnston Adam G | -- | None Available | |
| Southland Properties Llc | $250,000 | Attorney | |
| Johnston David A | $110,000 | -- | |
| Geraci Sue | $92,500 | -- |
Source: Public Records
Mortgage History
| Date | Status | Borrower | Loan Amount |
|---|---|---|---|
| Previous Owner | Johnston David A | $88,000 | |
| Previous Owner | Geraci Sue | $74,000 |
Source: Public Records
Tax History
| Year | Tax Paid | Tax Assessment Tax Assessment Total Assessment is a certain percentage of the fair market value that is determined by local assessors to be the total taxable value of land and additions on the property. | Land | Improvement |
|---|---|---|---|---|
| 2025 | $2,370 | $43,645 | $9,919 | $33,726 |
| 2023 | $2,366 | $43,645 | $9,919 | $33,726 |
| 2022 | $2,469 | $35,379 | $7,977 | $27,402 |
| 2021 | $2,113 | $35,379 | $7,977 | $27,402 |
| 2020 | $2,083 | $35,379 | $7,977 | $27,402 |
| 2019 | $2,029 | $31,308 | $7,060 | $24,248 |
| 2018 | $2,030 | $31,308 | $7,060 | $24,248 |
| 2017 | $1,940 | $31,308 | $7,060 | $24,248 |
| 2016 | $2,020 | $32,354 | $7,476 | $24,878 |
| 2015 | $2,011 | $32,354 | $7,476 | $24,878 |
| 2014 | $1,767 | $32,354 | $7,476 | $24,878 |
| 2013 | $1,791 | $33,016 | $7,630 | $25,386 |
Source: Public Records
Map
Nearby Homes
- 18 Gahl Terrace
- 26 Gahl Terrace
- 9350 Reading Rd
- 54 Gorman Ln
- 52 Gahl Terrace
- 59 Gorman Ln
- 268 Shirljune Dr
- 68 Gorman Ln
- 1521 Hunt Rd
- 134 W Crest Dr
- 234 Mcguire Ln
- 1904 Hunt Rd
- 103 W Crest Dr
- 1421 Jefferson Ave
- 1401 Jefferson Ave
- 1725 Guise Ct
- 310 E Vine St
- 1320 Thurnridge Dr
- 2258 Hunt Rd
- 329 Walnut St
- 9432 Reading Rd
- 9440 Reading Rd
- 9444 Reading Rd
- 9426 Reading Rd
- 9448 Reading Rd
- 0 Landy Ln
- 9420 Reading Rd
- 9412 Reading Rd
- 9443 Reading Rd
- 9456 Reading Rd
- 9445 Reading Rd
- 9460 Reading Rd
- 9451 Reading Rd
- 9464 Reading Rd
- 9468 Reading Rd
- 9459 Reading Rd
- 24 Landy Ln
- 9461 Reading Rd
- 9465 Reading Rd
- 9469 Reading Rd
Your Personal Tour Guide
Ask me questions while you tour the home.