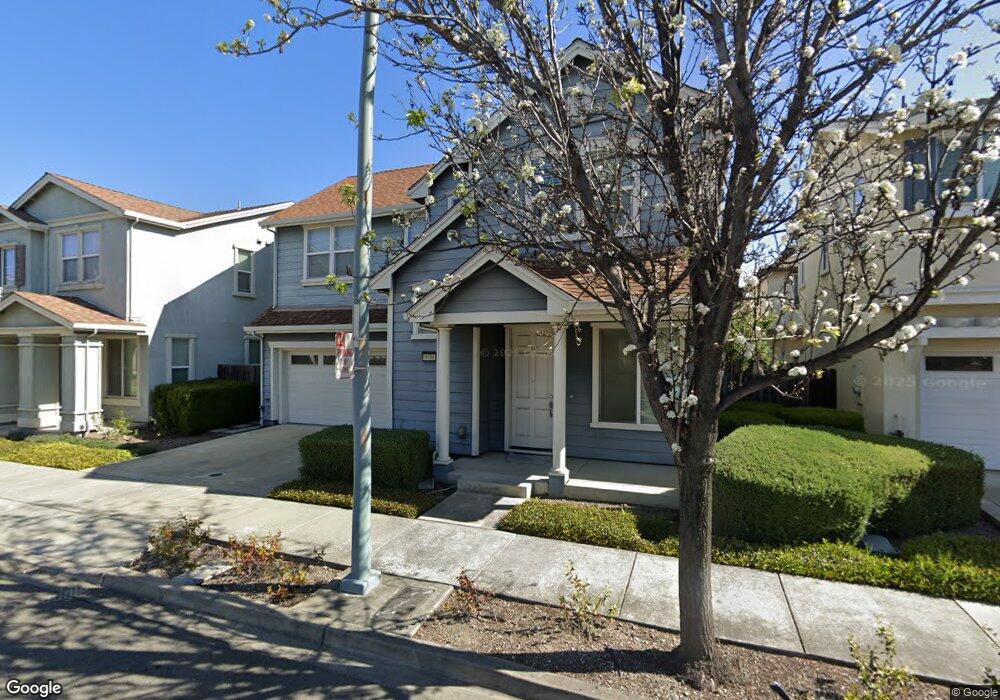
9436 Tanner Oakland, CA 94603
Elmhurst Park NeighborhoodEstimated Value: $692,112 - $745,000
3
Beds
3
Baths
1,647
Sq Ft
$429/Sq Ft
Est. Value
About This Home
This home is located at 9436 Tanner, Oakland, CA 94603 and is currently estimated at $706,778, approximately $429 per square foot. 9436 Tanner is a home located in Alameda County with nearby schools including Fred T. Korematsu Discovery Academy, Esperanza Elementary School, and Madison Park Academy (6-12).
Ownership History
Date
Name
Owned For
Owner Type
Purchase Details
Closed on
Feb 4, 2025
Sold by
Simmons Ollie J
Bought by
Ollie Jerome Simmons Revocable Trust and Simmons
Current Estimated Value
Purchase Details
Closed on
Aug 6, 2009
Sold by
Pulte Home Corporation
Bought by
Simmons Ollie J
Home Financials for this Owner
Home Financials are based on the most recent Mortgage that was taken out on this home.
Original Mortgage
$352,497
Interest Rate
4.75%
Mortgage Type
FHA
Create a Home Valuation Report for This Property
The Home Valuation Report is an in-depth analysis detailing your home's value as well as a comparison with similar homes in the area
Home Values in the Area
Average Home Value in this Area
Purchase History
| Date | Buyer | Sale Price | Title Company |
|---|---|---|---|
| Ollie Jerome Simmons Revocable Trust | -- | None Listed On Document | |
| Simmons Ollie J | $359,000 | Chicago Title Company |
Source: Public Records
Mortgage History
| Date | Status | Borrower | Loan Amount |
|---|---|---|---|
| Previous Owner | Simmons Ollie J | $352,497 |
Source: Public Records
Tax History
| Year | Tax Paid | Tax Assessment Tax Assessment Total Assessment is a certain percentage of the fair market value that is determined by local assessors to be the total taxable value of land and additions on the property. | Land | Improvement |
|---|---|---|---|---|
| 2025 | $7,476 | $456,371 | $139,011 | $324,360 |
| 2024 | $7,476 | $447,288 | $136,286 | $318,002 |
| 2023 | $7,803 | $445,381 | $133,614 | $311,767 |
| 2022 | $7,574 | $429,651 | $130,995 | $305,656 |
| 2021 | $7,192 | $421,092 | $128,427 | $299,665 |
| 2020 | $7,112 | $423,705 | $127,111 | $296,594 |
| 2019 | $6,813 | $415,398 | $124,619 | $290,779 |
| 2018 | $6,568 | $407,256 | $122,177 | $285,079 |
| 2017 | $6,405 | $399,271 | $119,781 | $279,490 |
| 2016 | $6,163 | $391,445 | $117,433 | $274,012 |
| 2015 | $6,129 | $385,568 | $115,670 | $269,898 |
| 2014 | $6,169 | $378,018 | $113,405 | $264,613 |
Source: Public Records
Map
Nearby Homes
Your Personal Tour Guide
Ask me questions while you tour the home.