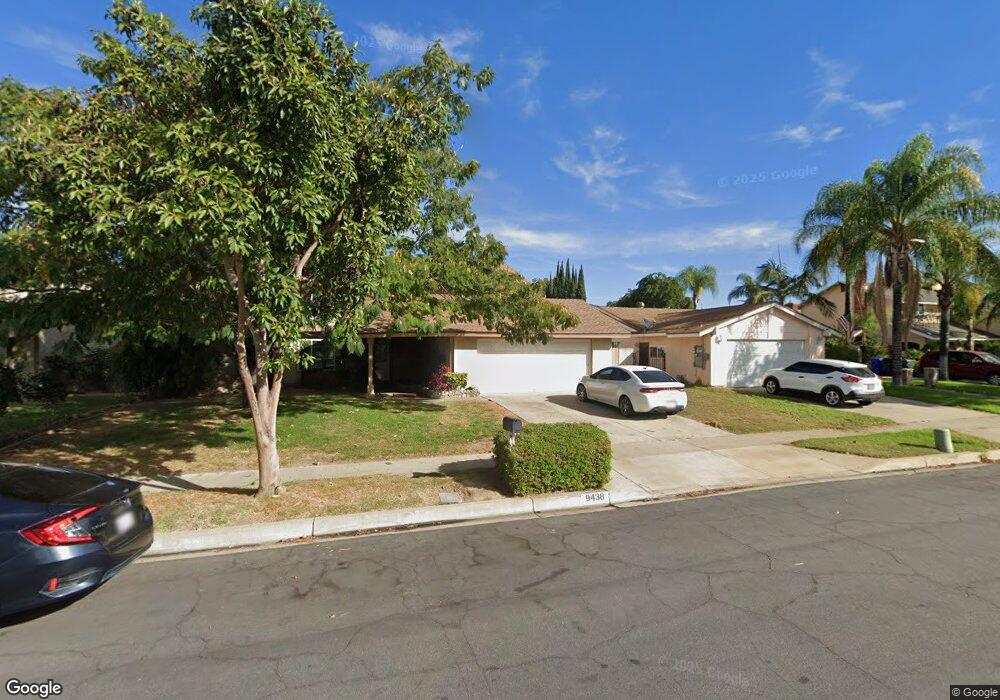
9438 Deerbrook St Rancho Cucamonga, CA 91730
Estimated Value: $741,000 - $750,000
4
Beds
3
Baths
1,840
Sq Ft
$406/Sq Ft
Est. Value
About This Home
This home is located at 9438 Deerbrook St, Rancho Cucamonga, CA 91730 and is currently estimated at $746,526, approximately $405 per square foot. 9438 Deerbrook St is a home located in San Bernardino County with nearby schools including Los Amigos Elementary, Rancho Cucamonga Middle, and Chaffey High School.
Ownership History
Date
Name
Owned For
Owner Type
Purchase Details
Closed on
Mar 30, 2007
Sold by
Silverman Samuel L
Bought by
Silverman Samuel L and Samuel L Silverman Trust
Current Estimated Value
Purchase Details
Closed on
Jun 6, 2006
Sold by
Silverman Samuel L and Silverman Cheryl L
Bought by
Silverman Samuel L
Purchase Details
Closed on
Jun 13, 1996
Sold by
Bak Silverman Samuel L and Bak Cheryl L
Bought by
Silverman Samuel L and Silverman Cheryl L
Create a Home Valuation Report for This Property
The Home Valuation Report is an in-depth analysis detailing your home's value as well as a comparison with similar homes in the area
Home Values in the Area
Average Home Value in this Area
Purchase History
| Date | Buyer | Sale Price | Title Company |
|---|---|---|---|
| Silverman Samuel L | -- | None Available | |
| Silverman Samuel L | -- | None Available | |
| Silverman Samuel L | -- | -- |
Source: Public Records
Tax History Compared to Growth
Tax History
| Year | Tax Paid | Tax Assessment Tax Assessment Total Assessment is a certain percentage of the fair market value that is determined by local assessors to be the total taxable value of land and additions on the property. | Land | Improvement |
|---|---|---|---|---|
| 2025 | $2,011 | $190,275 | $31,713 | $158,562 |
| 2024 | $2,011 | $186,544 | $31,091 | $155,453 |
| 2023 | $1,965 | $182,886 | $30,481 | $152,405 |
| 2022 | $1,940 | $180,205 | $29,294 | $150,911 |
| 2021 | $1,923 | $176,672 | $28,720 | $147,952 |
| 2020 | $1,889 | $174,861 | $28,426 | $146,435 |
| 2019 | $1,879 | $171,433 | $27,869 | $143,564 |
| 2018 | $1,833 | $168,072 | $27,323 | $140,749 |
| 2017 | $1,766 | $164,776 | $26,787 | $137,989 |
| 2016 | $1,744 | $161,545 | $26,262 | $135,283 |
| 2015 | $1,732 | $159,119 | $25,868 | $133,251 |
| 2014 | $1,680 | $156,002 | $25,361 | $130,641 |
Source: Public Records
Map
Nearby Homes
- 9330 Alderwood Dr
- 9357 Culinary Place
- 9175 Jadeite Ave
- 9403 Old Post Dr
- 9427 Sun Meadow Ct
- 9523 Sunglow Ct
- 9593 Brook Dr
- 9550 Springbrook Ct
- 1834 N Solano Ave
- 2008 E 5th St
- 2139 E 4th St #244 St Unit 244
- 2139 E 4th St Unit 135
- 2139 E 4th St Unit 13
- 2139 E 4th St Unit 230
- 2139 E 4th St Unit 79
- 2139 E 4th St Unit 90
- 2139 E 4th St Unit 39
- 2139 E 4th St Unit 142
- 2139 E 4th St Unit 176
- 2139 E 4th St Unit 244
- 9446 Deerbrook St
- 9420 Deerbrook St
- 9437 Cameron St
- 9445 Cameron St
- 9427 Cameron St
- 9456 Deerbrook St
- 9414 Deerbrook St
- 9211 Layton St
- 9455 Cameron St
- 9419 Cameron St
- 9421 Deerbrook St
- 9404 Deerbrook St
- 9466 Deerbrook St
- 9219 Layton St
- 9465 Cameron St
- 9409 Cameron St
- 9413 Deerbrook St
- 9212 Amethyst Ave
- 9398 Deerbrook St
- 9403 Deerbrook St