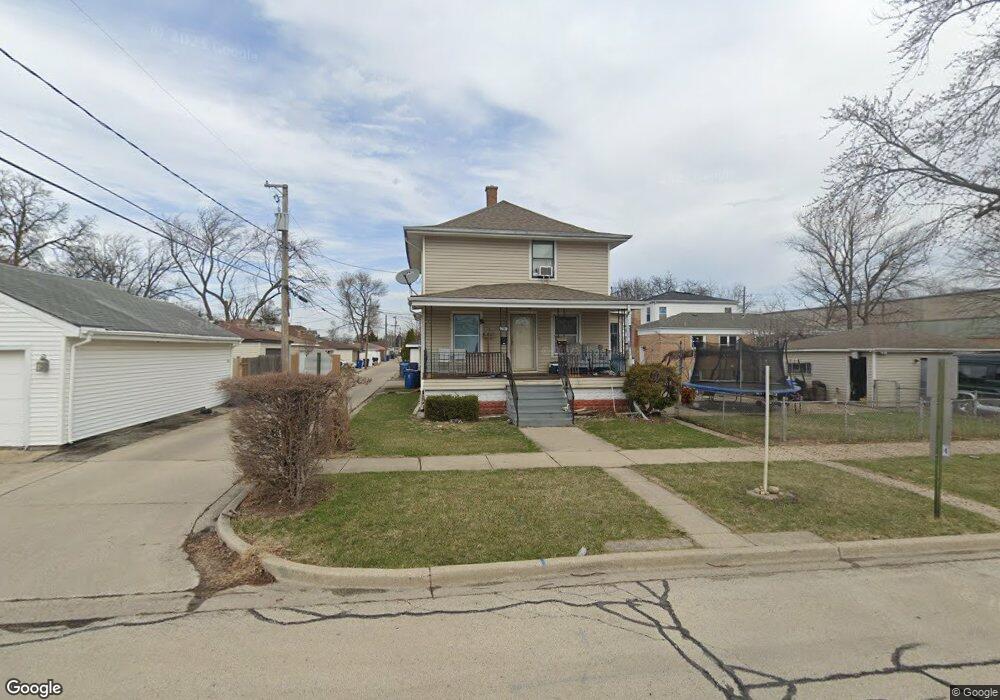
9438 Gage Ave Franklin Park, IL 60131
Estimated Value: $298,000 - $351,152
4
Beds
2
Baths
1,452
Sq Ft
$231/Sq Ft
Est. Value
About This Home
This home is located at 9438 Gage Ave, Franklin Park, IL 60131 and is currently estimated at $334,788, approximately $230 per square foot. 9438 Gage Ave is a home located in Cook County with nearby schools including North Elementary School, Hester Jr High School, and East Leyden High School.
Ownership History
Date
Name
Owned For
Owner Type
Purchase Details
Closed on
Sep 3, 2004
Sold by
Cortes Antolin R and Cortes Maria
Bought by
Gamez Gilberto and Gamez Rosa E
Current Estimated Value
Home Financials for this Owner
Home Financials are based on the most recent Mortgage that was taken out on this home.
Original Mortgage
$195,000
Outstanding Balance
$92,522
Interest Rate
5.25%
Mortgage Type
Unknown
Estimated Equity
$242,266
Purchase Details
Closed on
Jun 5, 1998
Sold by
Cortez Antolin R and Gutierrez Maria
Bought by
Cortez Antolin R and Gutierrez Maria
Home Financials for this Owner
Home Financials are based on the most recent Mortgage that was taken out on this home.
Original Mortgage
$141,000
Interest Rate
10.5%
Purchase Details
Closed on
Nov 28, 1994
Sold by
Picicci Nicola
Bought by
Cortes Antolin R and Gutierrez Maria
Home Financials for this Owner
Home Financials are based on the most recent Mortgage that was taken out on this home.
Original Mortgage
$128,250
Interest Rate
6.75%
Create a Home Valuation Report for This Property
The Home Valuation Report is an in-depth analysis detailing your home's value as well as a comparison with similar homes in the area
Home Values in the Area
Average Home Value in this Area
Purchase History
| Date | Buyer | Sale Price | Title Company |
|---|---|---|---|
| Gamez Gilberto | $225,000 | Pntn | |
| Cortez Antolin R | -- | Nations Title Agency | |
| Cortes Antolin R | $135,000 | Attorneys Natl Title Network |
Source: Public Records
Mortgage History
| Date | Status | Borrower | Loan Amount |
|---|---|---|---|
| Open | Gamez Gilberto | $195,000 | |
| Previous Owner | Cortez Antolin R | $141,000 | |
| Previous Owner | Cortes Antolin R | $128,250 |
Source: Public Records
Tax History Compared to Growth
Tax History
| Year | Tax Paid | Tax Assessment Tax Assessment Total Assessment is a certain percentage of the fair market value that is determined by local assessors to be the total taxable value of land and additions on the property. | Land | Improvement |
|---|---|---|---|---|
| 2024 | $5,231 | $23,000 | $7,477 | $15,523 |
| 2023 | $3,369 | $23,000 | $7,477 | $15,523 |
| 2022 | $3,369 | $23,000 | $7,477 | $15,523 |
| 2021 | $5,420 | $17,013 | $5,400 | $11,613 |
| 2020 | $5,242 | $17,013 | $5,400 | $11,613 |
| 2019 | $5,472 | $19,224 | $5,400 | $13,824 |
| 2018 | $6,079 | $18,502 | $4,569 | $13,933 |
| 2017 | $6,016 | $18,502 | $4,569 | $13,933 |
| 2016 | $5,916 | $18,502 | $4,569 | $13,933 |
| 2015 | $5,379 | $16,398 | $4,154 | $12,244 |
| 2014 | $5,258 | $16,398 | $4,154 | $12,244 |
| 2013 | $4,852 | $16,398 | $4,154 | $12,244 |
Source: Public Records
Map
Nearby Homes
- 3340 Pearl St
- 9504 Nerbonne Ave
- 3321 Ruby St
- 9044 Walnut Ave
- 3421 Elder Ln
- 3706 Ruby St
- 3721 Ruby St Unit 103S
- 3709 Emerson St
- 3623 Hawthorne St
- 3848 25th Ave Unit 38485
- 9770 Ivanhoe Ave
- 9146 Grand Ave Unit 1SE
- 3507 Louis St
- 3515 Louis St
- 2829 Elder Ln
- 3519 Louis St
- 2843 Hawthorne St
- 3652 Hawthorne St
- 2946 N River Rd
- 9727 Johanna Ave
- 3308 Washington St
- 3314 Washington St
- 3314 Washington St
- 3250 Washington St
- 3301 Edgington St
- 3318 Washington St
- 3305 Edgington St
- 3309 Edgington St
- 3246 Washington St
- 3313 Edgington St
- 3249 Edgington St
- 3242 Washington St
- 3315 Edgington St
- 3245 Edgington St
- 3319 Edgington St
- 3319 Edgington St
- 3330 Washington St
- 3240 Washington St
- 3241 Edgington St
- 3332 Washington St