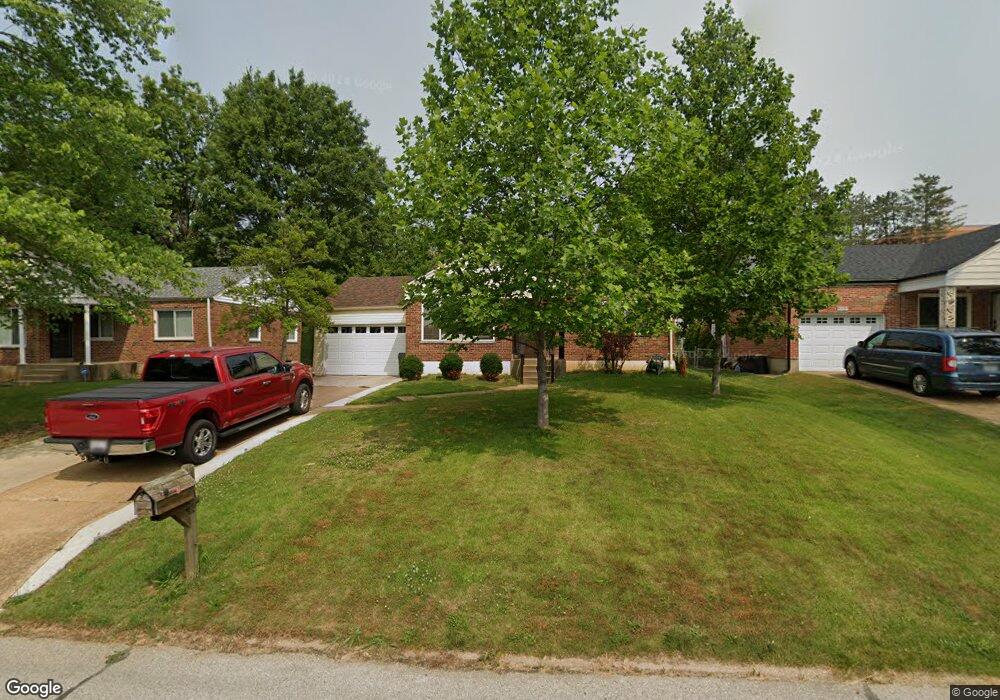
9439 High Hill Ct Saint Louis, MO 63126
Estimated Value: $273,000 - $308,000
2
Beds
1
Bath
1,142
Sq Ft
$249/Sq Ft
Est. Value
About This Home
This home is located at 9439 High Hill Ct, Saint Louis, MO 63126 and is currently estimated at $284,310, approximately $248 per square foot. 9439 High Hill Ct is a home located in St. Louis County with nearby schools including Long Elementary, Truman Middle School, and Lindbergh High School.
Ownership History
Date
Name
Owned For
Owner Type
Purchase Details
Closed on
Aug 28, 2017
Sold by
Ferguson Michael and Ferguson Michelle M
Bought by
Ferguson Michelle
Current Estimated Value
Home Financials for this Owner
Home Financials are based on the most recent Mortgage that was taken out on this home.
Original Mortgage
$35,000
Interest Rate
3.92%
Mortgage Type
Credit Line Revolving
Purchase Details
Closed on
Sep 15, 2003
Sold by
Ferguson Mark
Bought by
Ferguson Michael
Home Financials for this Owner
Home Financials are based on the most recent Mortgage that was taken out on this home.
Original Mortgage
$100,000
Interest Rate
6.31%
Mortgage Type
Purchase Money Mortgage
Purchase Details
Closed on
May 22, 2002
Sold by
Mack Paul I
Bought by
Ferguson Mark
Home Financials for this Owner
Home Financials are based on the most recent Mortgage that was taken out on this home.
Original Mortgage
$78,200
Interest Rate
6.96%
Mortgage Type
Seller Take Back
Create a Home Valuation Report for This Property
The Home Valuation Report is an in-depth analysis detailing your home's value as well as a comparison with similar homes in the area
Home Values in the Area
Average Home Value in this Area
Purchase History
| Date | Buyer | Sale Price | Title Company |
|---|---|---|---|
| Ferguson Michelle | -- | Touchstone Title & Abstract | |
| Ferguson Michael | $125,000 | -- | |
| Ferguson Mark | $92,000 | Capital Title |
Source: Public Records
Mortgage History
| Date | Status | Borrower | Loan Amount |
|---|---|---|---|
| Closed | Ferguson Michelle | $35,000 | |
| Closed | Ferguson Michael | $100,000 | |
| Closed | Ferguson Mark | $78,200 |
Source: Public Records
Tax History Compared to Growth
Tax History
| Year | Tax Paid | Tax Assessment Tax Assessment Total Assessment is a certain percentage of the fair market value that is determined by local assessors to be the total taxable value of land and additions on the property. | Land | Improvement |
|---|---|---|---|---|
| 2025 | $2,912 | $46,360 | $18,640 | $27,720 |
| 2024 | $2,912 | $41,820 | $18,640 | $23,180 |
| 2023 | $2,692 | $41,820 | $18,640 | $23,180 |
| 2022 | $2,841 | $39,330 | $18,640 | $20,690 |
| 2021 | $2,086 | $31,600 | $18,640 | $12,960 |
| 2020 | $2,002 | $29,240 | $13,980 | $15,260 |
| 2019 | $1,997 | $29,240 | $13,980 | $15,260 |
| 2018 | $1,815 | $24,060 | $8,760 | $15,300 |
| 2017 | $1,796 | $24,060 | $8,760 | $15,300 |
| 2016 | $1,753 | $23,790 | $7,810 | $15,980 |
| 2015 | $1,763 | $23,790 | $7,810 | $15,980 |
| 2014 | $1,565 | $20,860 | $6,670 | $14,190 |
Source: Public Records
Map
Nearby Homes
- 9535 Arban Dr
- 9610 Carrimae Ct
- 9405 Vandervoort Ct
- 8737 Villa Crest Dr
- 9608 Greenview Dr
- 9609 Twincrest Dr
- 8619 Del Vista Dr
- 8867 Red Oak Dr
- 1543 Fournier Dr
- 8907 Grantway Ct
- 8948 Crest Oak Ln
- 9188 Rusticwood Trail
- 8726 Gayle Ave
- 745 Montego Dr
- 7910 Royal Arms Ct Unit 1
- 640 Clover Ln
- 614 Conover Ln
- 8914 Chasebury Terrace
- 9606 Castanet Ct
- 631 Clover Ln
- 9443 High Hill Ct
- 9435 High Hill Ct
- 9447 High Hill Ct
- 9431 High Hill Ct
- 9446 High Hill Ct
- 9438 High Hill Ct
- 9501 Arban Dr
- 9427 High Hill Ct
- 9479 Arban Dr
- 9432 High Hill Ct
- 9509 Arban Dr
- 9423 High Hill Ct
- 9473 Arban Dr
- 9426 High Hill Ct
- 9488 Arban Dr
- 9484 Arban Dr
- 9492 Arban Dr
- 9419 High Hill Ct
- 9515 Arban Dr
- 9500 Arban Dr