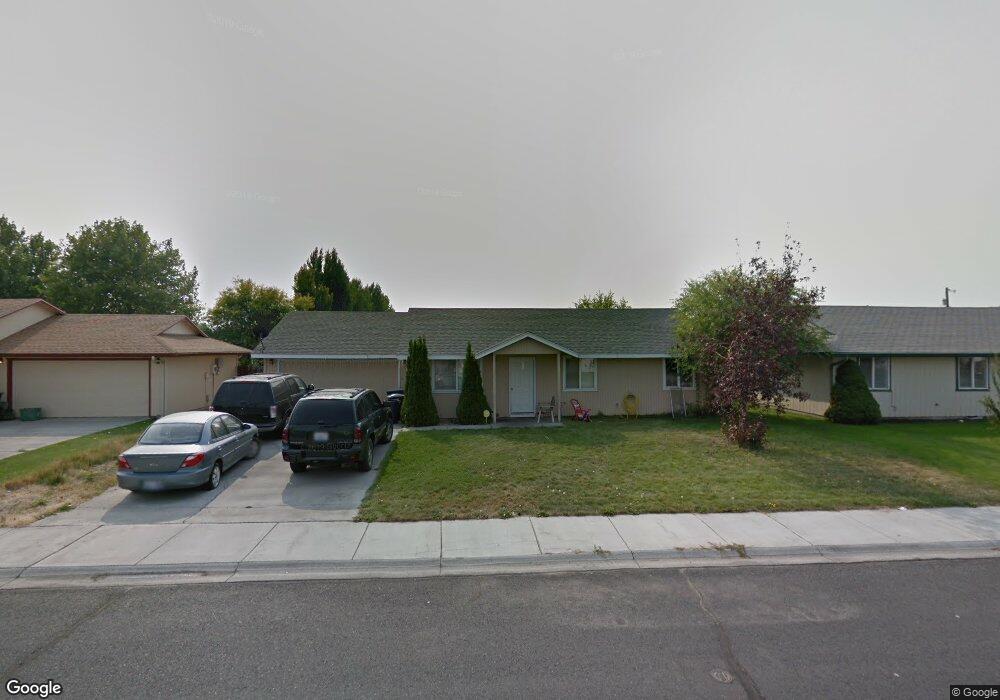
944 E Hayden Dr Moses Lake, WA 98837
Estimated Value: $295,000 - $343,000
3
Beds
2
Baths
1,120
Sq Ft
$280/Sq Ft
Est. Value
About This Home
This home is located at 944 E Hayden Dr, Moses Lake, WA 98837 and is currently estimated at $313,274, approximately $279 per square foot. 944 E Hayden Dr is a home located in Grant County with nearby schools including Lakeview Terrace Elementary School, Columbia Middle School, and Moses Lake High School.
Ownership History
Date
Name
Owned For
Owner Type
Purchase Details
Closed on
Jul 22, 2019
Sold by
Dekker Rosa and Dekker David C
Bought by
Martinez Dedekker Rosa and Dekker David C
Current Estimated Value
Home Financials for this Owner
Home Financials are based on the most recent Mortgage that was taken out on this home.
Original Mortgage
$156,400
Interest Rate
3.82%
Mortgage Type
New Conventional
Purchase Details
Closed on
Oct 24, 2014
Sold by
Dekker Rosa and De Dekker Rosa Martinez
Bought by
Dekker David C and Dekker Rosa
Home Financials for this Owner
Home Financials are based on the most recent Mortgage that was taken out on this home.
Original Mortgage
$96,000
Interest Rate
4.2%
Mortgage Type
New Conventional
Purchase Details
Closed on
Jan 27, 2014
Sold by
Martinez Santiago V
Bought by
Dedekker Rosa Martinez
Create a Home Valuation Report for This Property
The Home Valuation Report is an in-depth analysis detailing your home's value as well as a comparison with similar homes in the area
Home Values in the Area
Average Home Value in this Area
Purchase History
| Date | Buyer | Sale Price | Title Company |
|---|---|---|---|
| Martinez Dedekker Rosa | -- | Ticor Title Company | |
| Dekker David C | -- | Frontier Title | |
| Dedekker Rosa Martinez | -- | Frontier Title |
Source: Public Records
Mortgage History
| Date | Status | Borrower | Loan Amount |
|---|---|---|---|
| Closed | Martinez Dedekker Rosa | $156,400 | |
| Closed | Dekker David C | $96,000 |
Source: Public Records
Tax History Compared to Growth
Tax History
| Year | Tax Paid | Tax Assessment Tax Assessment Total Assessment is a certain percentage of the fair market value that is determined by local assessors to be the total taxable value of land and additions on the property. | Land | Improvement |
|---|---|---|---|---|
| 2024 | $3,080 | $264,468 | $42,500 | $221,968 |
| 2023 | $2,357 | $186,645 | $25,000 | $161,645 |
| 2022 | $2,258 | $186,645 | $25,000 | $161,645 |
| 2021 | $1,923 | $186,645 | $25,000 | $161,645 |
| 2020 | $2,002 | $152,250 | $25,000 | $127,250 |
| 2019 | $1,987 | $134,070 | $25,000 | $109,070 |
| 2018 | $2,230 | $140,560 | $25,000 | $115,560 |
| 2017 | $2,107 | $134,780 | $25,000 | $109,780 |
| 2016 | $1,824 | $116,135 | $30,000 | $86,135 |
| 2013 | -- | $111,155 | $40,000 | $71,155 |
Source: Public Records
Map
Nearby Homes
- 941 E Hayden Dr
- 1001 E Hayden Dr
- 1412 E Hunter Place
- 1042 S Lakeland Dr
- 1221 S Lakeland Dr
- 1346 E Oasis Cir
- 927 E Cherry Ave
- 1346 Greens Loop
- 1059 July Ct
- 1055 July Ct
- 0 NNA S Pioneer Way
- 426 E Brown Ave
- 840 S Grand Dr
- 940 S Ironwood Dr
- 528 Sharon Ave E
- 1122 S Skyline Dr
- 814 S Blessing St
- 1311 S Vandal Ct
- 835 S Kiefer Dr
- 123 E 9th Ave Unit 57
- 940 E Hayden Dr
- 1000 E Hayden Dr
- 1004 E Hayden Dr
- 936 E Hayden Dr
- 945 E Hayden Dr
- 937 E Hayden Dr
- 1008 E Hayden Dr
- 1005 E Hayden Dr
- 1005 E Hayden Dr
- 932 E Hayden Dr
- 1160 S Grand Dr
- 921 E Hayden Dr
- 1158 S Grand Dr
- 1162 S Grand Dr
- 1009 E Hayden Dr
- 1012 E Hayden Dr
- 928 E Hayden Dr
- 1164 S Grand Dr
- 1156 S Grand Dr
- 1013 E Hayden Dr