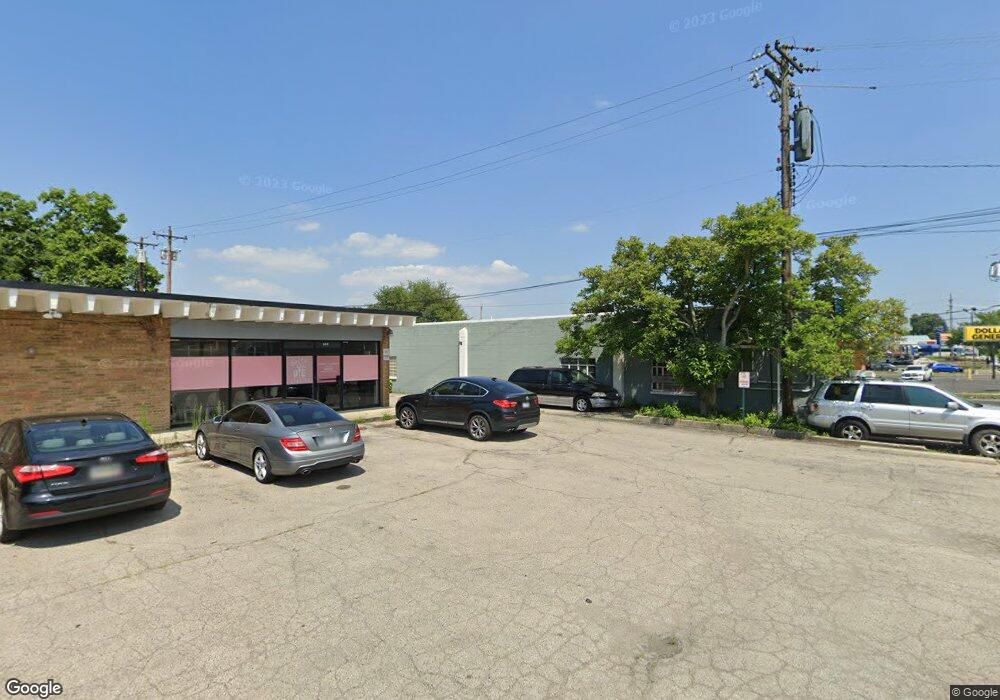
944 N Bend Rd Springfield Twp., OH 45224
Finneytown Neighborhood
Studio
--
Bath
4,378
Sq Ft
19,646
Sq Ft Lot
About This Home
This home is located at 944 N Bend Rd, Springfield Twp., OH 45224. 944 N Bend Rd is a home located in Hamilton County with nearby schools including Finneytown Elementary School, Finneytown Secondary Campus, and Northside Preparatory Academy.
Ownership History
Date
Name
Owned For
Owner Type
Purchase Details
Closed on
Nov 26, 2025
Sold by
Multan Properties Llc and Singh Gurmukh
Bought by
143 Woolper Llc
Purchase Details
Closed on
Feb 28, 2023
Sold by
Ghuman Inc
Bought by
Multan Properties Llc
Home Financials for this Owner
Home Financials are based on the most recent Mortgage that was taken out on this home.
Original Mortgage
$315,201
Interest Rate
6.15%
Mortgage Type
New Conventional
Purchase Details
Closed on
Jul 21, 2006
Sold by
Sandusky Christine A
Bought by
Ghuman Inc
Home Financials for this Owner
Home Financials are based on the most recent Mortgage that was taken out on this home.
Original Mortgage
$220,000
Interest Rate
6.82%
Mortgage Type
Commercial
Purchase Details
Closed on
Aug 5, 2004
Sold by
Harlex Co
Bought by
Sandusky Christine A
Home Financials for this Owner
Home Financials are based on the most recent Mortgage that was taken out on this home.
Original Mortgage
$420,000
Interest Rate
6.1%
Mortgage Type
Commercial
Create a Home Valuation Report for This Property
The Home Valuation Report is an in-depth analysis detailing your home's value as well as a comparison with similar homes in the area
Home Values in the Area
Average Home Value in this Area
Purchase History
| Date | Buyer | Sale Price | Title Company |
|---|---|---|---|
| 143 Woolper Llc | -- | None Listed On Document | |
| Multan Properties Llc | $250 | None Listed On Document | |
| Multan Properties Llc | $250 | None Listed On Document | |
| Ghuman Inc | -- | None Available | |
| Sandusky Christine A | -- | -- | |
| Sandusky Christine A | -- | -- |
Source: Public Records
Mortgage History
| Date | Status | Borrower | Loan Amount |
|---|---|---|---|
| Previous Owner | Multan Properties Llc | $315,201 | |
| Previous Owner | Ghuman Inc | $220,000 | |
| Previous Owner | Sandusky Christine A | $420,000 |
Source: Public Records
Tax History
| Year | Tax Paid | Tax Assessment Tax Assessment Total Assessment is a certain percentage of the fair market value that is determined by local assessors to be the total taxable value of land and additions on the property. | Land | Improvement |
|---|---|---|---|---|
| 2025 | $10,618 | $95,862 | $75,467 | $20,395 |
| 2024 | $10,668 | $95,862 | $75,467 | $20,395 |
| 2023 | $10,394 | $95,862 | $75,467 | $20,395 |
| 2022 | $11,417 | $86,668 | $70,711 | $15,957 |
| 2021 | $11,422 | $86,668 | $70,711 | $15,957 |
| 2020 | $11,236 | $86,668 | $70,711 | $15,957 |
| 2019 | $10,906 | $84,144 | $68,653 | $15,491 |
| 2018 | $10,256 | $84,144 | $68,653 | $15,491 |
| 2017 | $9,998 | $84,144 | $68,653 | $15,491 |
| 2016 | $9,468 | $79,605 | $76,283 | $3,322 |
| 2015 | $9,405 | $79,605 | $76,283 | $3,322 |
| 2014 | $9,390 | $79,605 | $76,283 | $3,322 |
| 2013 | $9,313 | $79,605 | $76,283 | $3,322 |
Source: Public Records
Map
Nearby Homes
- 6509 Greenfield Woods Dr S
- 6621 Winton Rd
- 6683 Greentree Dr
- 6728 Sandalwood Ln
- 6123 Kingsford Dr
- 6629 Charann Ln
- 6024 Sunridge Dr
- 7214 Greenfarms Dr
- 1011 Venetian Terrace
- 6000 Capri Dr
- 6101 Capri Dr
- 6848 Somerset Dr
- 7281 Winton Rd
- 6837 Warder Dr
- 6045 Tahiti Dr
- 1148 Hollywood Ave
- 6538 S Oak Knoll Dr
- 1197 Toluca Ct
- 6669 Kirkland Dr
- 5945 Leffingwell Ave
- 6511 Greentree Dr
- 954 W North Bend Rd
- 937 N Bend Rd
- 6517 Greentree Dr
- 6528 Greentree Dr
- 935 N Bend Rd
- 935 W North Bend Rd
- 935 Bend Rd N
- 945 W North Bend Rd
- 958 W North Bend Rd
- 6543 Greentree Dr
- 6540 Greentree Dr
- 6501 Greenfield Woods Dr S
- 941 W North Bend Rd
- 6557 Greentree Dr
- 6554 Greentree Dr
- 6501 Greenfield Woods Dr S
- 6505 Greenfield Woods Dr S
- 6531 Winton Rd
- 962 W North Bend Rd
Your Personal Tour Guide
Ask me questions while you tour the home.