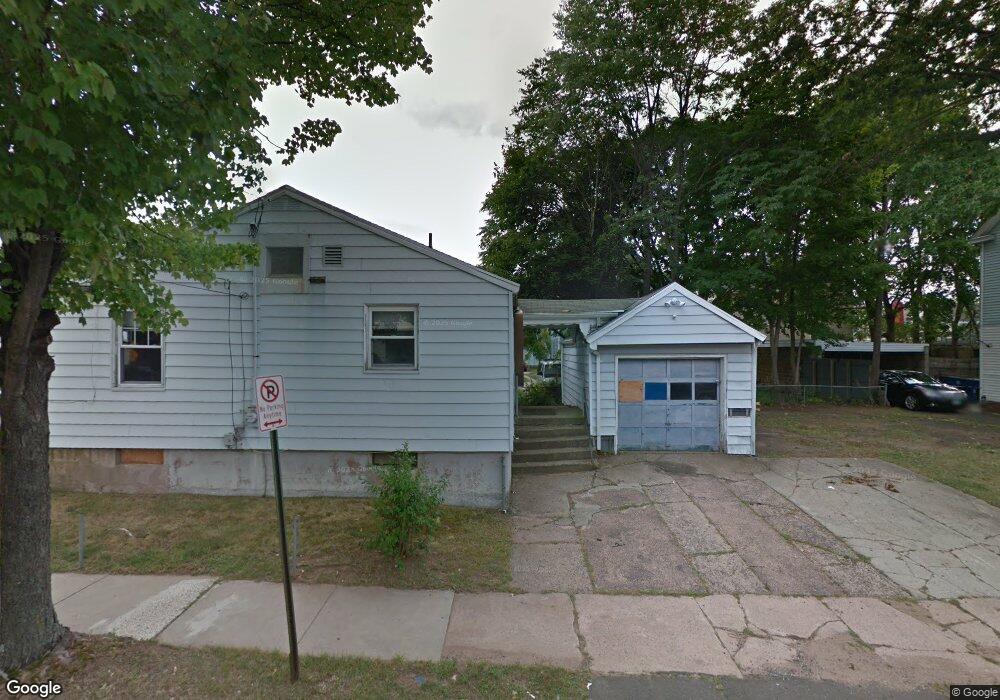
944 Sherman Ave New Haven, CT 06511
Newhallville NeighborhoodEstimated Value: $272,872 - $345,000
3
Beds
2
Baths
932
Sq Ft
$323/Sq Ft
Est. Value
About This Home
This home is located at 944 Sherman Ave, New Haven, CT 06511 and is currently estimated at $300,718, approximately $322 per square foot. 944 Sherman Ave is a home located in New Haven County with nearby schools including King/Robinson Magnet School, Highville Charter School, and Cedarhurst School.
Ownership History
Date
Name
Owned For
Owner Type
Purchase Details
Closed on
Jun 19, 2017
Sold by
Neighborhood Housing S
Bought by
Handy Robyn R
Current Estimated Value
Home Financials for this Owner
Home Financials are based on the most recent Mortgage that was taken out on this home.
Original Mortgage
$107,000
Outstanding Balance
$89,002
Interest Rate
4.02%
Mortgage Type
Purchase Money Mortgage
Estimated Equity
$211,716
Purchase Details
Closed on
May 26, 2015
Sold by
Hsbc Bank Usa Na Tr
Bought by
Neighborhood Housing S
Purchase Details
Closed on
Dec 11, 2014
Sold by
Wormley-Radford Valerie
Bought by
Hsbc Bank Usa Na
Purchase Details
Closed on
Oct 12, 2005
Sold by
Calhoon Lewis
Bought by
Wormley-Radford Valerie R
Purchase Details
Closed on
Apr 4, 2002
Sold by
Cross Country Inv Llc
Bought by
Barbara Stephen
Purchase Details
Closed on
Sep 5, 2001
Sold by
Peoples Bk
Bought by
Melbourne Llc
Create a Home Valuation Report for This Property
The Home Valuation Report is an in-depth analysis detailing your home's value as well as a comparison with similar homes in the area
Home Values in the Area
Average Home Value in this Area
Purchase History
| Date | Buyer | Sale Price | Title Company |
|---|---|---|---|
| Handy Robyn R | $120,000 | -- | |
| Neighborhood Housing S | -- | -- | |
| Hsbc Bank Usa Na | -- | -- | |
| Wormley-Radford Valerie R | $140,000 | -- | |
| Barbara Stephen | $90,000 | -- | |
| Melbourne Llc | $39,000 | -- |
Source: Public Records
Mortgage History
| Date | Status | Borrower | Loan Amount |
|---|---|---|---|
| Open | Melbourne Llc | $107,000 | |
| Closed | Melbourne Llc | $15,000 | |
| Previous Owner | Melbourne Llc | $2,000 |
Source: Public Records
Tax History Compared to Growth
Tax History
| Year | Tax Paid | Tax Assessment Tax Assessment Total Assessment is a certain percentage of the fair market value that is determined by local assessors to be the total taxable value of land and additions on the property. | Land | Improvement |
|---|---|---|---|---|
| 2025 | $5,734 | $145,530 | $32,620 | $112,910 |
| 2024 | $5,603 | $145,530 | $32,620 | $112,910 |
| 2023 | $5,414 | $145,530 | $32,620 | $112,910 |
| 2022 | $5,785 | $145,530 | $32,620 | $112,910 |
| 2021 | $4,137 | $94,290 | $26,110 | $68,180 |
| 2020 | $4,137 | $94,290 | $26,110 | $68,180 |
| 2019 | $4,053 | $94,290 | $26,110 | $68,180 |
| 2018 | $4,053 | $94,290 | $26,110 | $68,180 |
| 2017 | $2,193 | $56,700 | $26,110 | $30,590 |
| 2016 | $1,370 | $32,970 | $11,620 | $21,350 |
| 2015 | $2,449 | $58,940 | $11,620 | $47,320 |
| 2014 | $2,449 | $58,940 | $11,620 | $47,320 |
Source: Public Records
Map
Nearby Homes
- 80 Elizabeth St
- 71 Pond St
- 69 Pond St
- 86 Elizabeth St Unit 3
- 77 Pond St
- 84 Elizabeth St
- 69 Elizabeth St
- 73 Elizabeth St
- 945 Sherman Ave
- 79 Elizabeth St
- 85 Pond St
- 63 Pond St
- 83 Elizabeth St
- 83 Elizabeth St Unit 3
- 92 Elizabeth St
- 65 Elizabeth St
- 54 Elizabeth St
- 91 Pond St
- 59 Elizabeth St
- 87 Elizabeth St