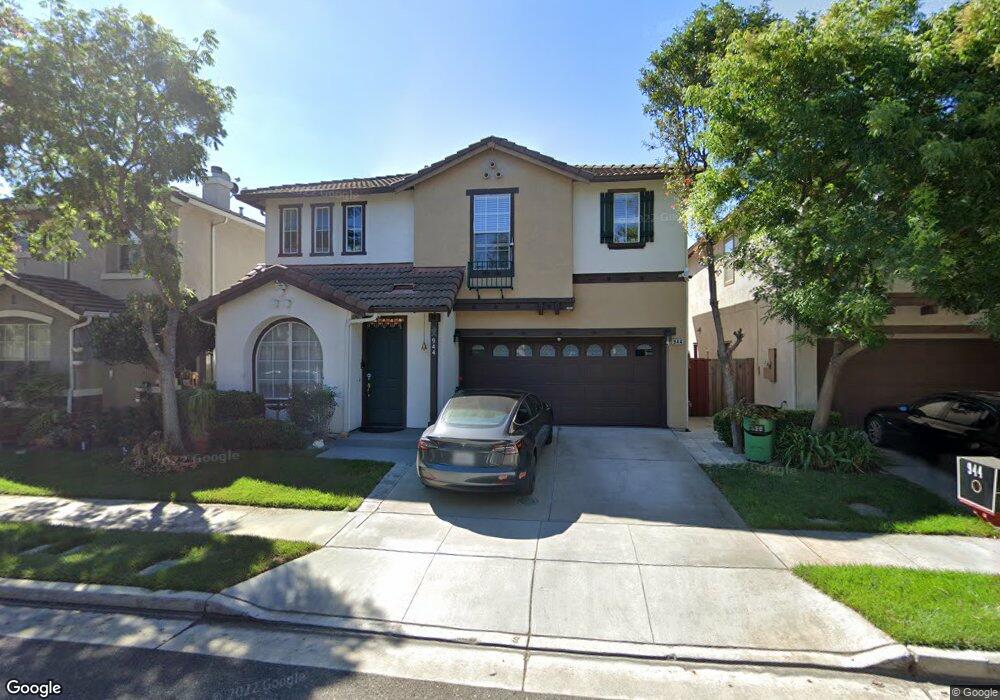
944 Sunbonnet Loop San Jose, CA 95125
South San Jose NeighborhoodEstimated Value: $1,864,000 - $1,965,000
5
Beds
3
Baths
2,377
Sq Ft
$805/Sq Ft
Est. Value
About This Home
This home is located at 944 Sunbonnet Loop, San Jose, CA 95125 and is currently estimated at $1,913,023, approximately $804 per square foot. 944 Sunbonnet Loop is a home located in Santa Clara County with nearby schools including Canoas Elementary School, John Muir Middle School, and Gunderson High School.
Ownership History
Date
Name
Owned For
Owner Type
Purchase Details
Closed on
Jun 12, 2017
Sold by
Patel Rajesh Ramesh
Bought by
Patel Rameshchandra B
Current Estimated Value
Purchase Details
Closed on
Mar 1, 2004
Sold by
Kumud Patel
Bought by
Rajesh Patel and Ram Patel
Purchase Details
Closed on
Jul 2, 2003
Sold by
Patel Kumud R and Patel Kumud
Bought by
Patel Kumud R
Home Financials for this Owner
Home Financials are based on the most recent Mortgage that was taken out on this home.
Original Mortgage
$117,000
Interest Rate
5.46%
Mortgage Type
Purchase Money Mortgage
Purchase Details
Closed on
Jun 13, 2000
Sold by
Kaufman & Broad South Bay Inc
Bought by
Patel Kumud
Home Financials for this Owner
Home Financials are based on the most recent Mortgage that was taken out on this home.
Original Mortgage
$200,000
Interest Rate
7.87%
Create a Home Valuation Report for This Property
The Home Valuation Report is an in-depth analysis detailing your home's value as well as a comparison with similar homes in the area
Home Values in the Area
Average Home Value in this Area
Purchase History
| Date | Buyer | Sale Price | Title Company |
|---|---|---|---|
| Patel Rameshchandra B | -- | None Available | |
| Rajesh Patel | -- | -- | |
| Patel Kumud R | -- | First American Title Co | |
| Patel Kumud | $523,000 | First American Title Guarant |
Source: Public Records
Mortgage History
| Date | Status | Borrower | Loan Amount |
|---|---|---|---|
| Previous Owner | Patel Kumud R | $117,000 | |
| Previous Owner | Patel Kumud | $200,000 |
Source: Public Records
Tax History
| Year | Tax Paid | Tax Assessment Tax Assessment Total Assessment is a certain percentage of the fair market value that is determined by local assessors to be the total taxable value of land and additions on the property. | Land | Improvement |
|---|---|---|---|---|
| 2025 | $10,371 | $787,909 | $376,701 | $411,208 |
| 2024 | $10,371 | $772,461 | $369,315 | $403,146 |
| 2023 | $10,163 | $757,316 | $362,074 | $395,242 |
| 2022 | $10,075 | $742,468 | $354,975 | $387,493 |
| 2021 | $9,855 | $727,911 | $348,015 | $379,896 |
| 2020 | $9,622 | $720,448 | $344,447 | $376,001 |
| 2019 | $9,411 | $706,323 | $337,694 | $368,629 |
| 2018 | $9,312 | $692,474 | $331,073 | $361,401 |
| 2017 | $9,233 | $678,897 | $324,582 | $354,315 |
| 2016 | $9,054 | $665,586 | $318,218 | $347,368 |
| 2015 | $8,990 | $655,590 | $313,439 | $342,151 |
| 2014 | $8,538 | $642,749 | $307,300 | $335,449 |
Source: Public Records
Map
Nearby Homes
- 2777 Rubino Cir
- 2764 Hageman Ct
- 2991 Almaden Rd
- 898 Hummingbird Dr
- 908 Redbird Dr
- 867 Ironwood Dr
- 2467 Nightingale Dr
- 1148 Husted Ave
- 2540 Marsha Way
- 2598 Cottle Ave
- 1111 Mayette Ave
- 1126 Roy Ave
- 1036 Pascoe Ave
- 2477 Westgate Ave
- 1127 Pascoe Ave
- 2320 Mazzaglia Ave
- 126 Mountain Springs Dr Unit 126
- 2212 Almaden Rd Unit A
- 1191 Carrie Lee Way
- 255 Mountain Springs Dr
- 946 Sunbonnet Loop
- 942 Sunbonnet Loop
- 926 Mcbride Loop
- 924 Mcbride Loop
- 928 Mcbride Loop
- 948 Sunbonnet Loop
- 922 Mcbride Loop
- 930 Mcbride Loop
- 945 Sunbonnet Loop
- 943 Sunbonnet Loop
- 938 Sunbonnet Loop
- 950 Sunbonnet Loop
- 920 Mcbride Loop
- 941 Sunbonnet Loop
- 949 Sunbonnet Loop
- 932 Mcbride Loop
- 952 Sunbonnet Loop
- 936 Sunbonnet Loop
- 939 Sunbonnet Loop
- 951 Sunbonnet Loop
Your Personal Tour Guide
Ask me questions while you tour the home.