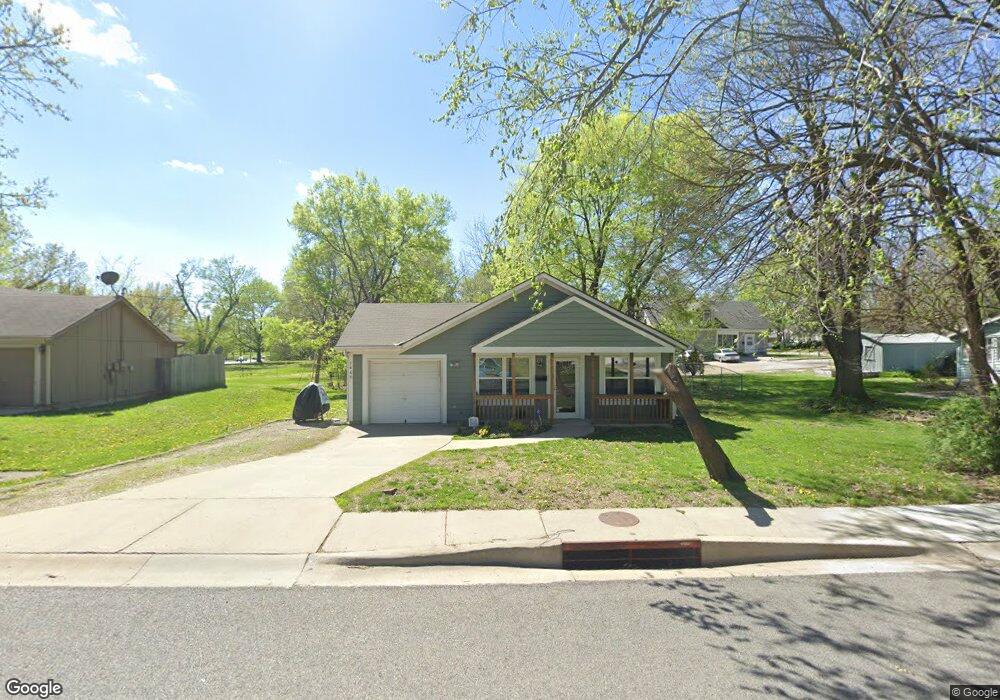
9440 Haskins St Lenexa, KS 66215
Estimated Value: $241,000 - $267,000
3
Beds
2
Baths
960
Sq Ft
$270/Sq Ft
Est. Value
About This Home
This home is located at 9440 Haskins St, Lenexa, KS 66215 and is currently estimated at $259,324, approximately $270 per square foot. 9440 Haskins St is a home located in Johnson County with nearby schools including Sunflower Elementary School, Westridge Middle School, and Shawnee Mission West High School.
Ownership History
Date
Name
Owned For
Owner Type
Purchase Details
Closed on
Feb 10, 2023
Sold by
Burgess Chad A
Bought by
Burgess Chad A and Burgess Hunter D
Current Estimated Value
Purchase Details
Closed on
Aug 18, 2004
Sold by
Meglemre Theodore M and Meglemre Amy J
Bought by
Dykmann Robert C and Dykmann Jeanne M
Home Financials for this Owner
Home Financials are based on the most recent Mortgage that was taken out on this home.
Original Mortgage
$100,000
Interest Rate
5.45%
Mortgage Type
Purchase Money Mortgage
Purchase Details
Closed on
Nov 14, 2001
Sold by
Ashlock Mitch and Ashlock Jill A
Bought by
Meglemre Theodore M and Meglemre Amy J
Home Financials for this Owner
Home Financials are based on the most recent Mortgage that was taken out on this home.
Original Mortgage
$114,948
Interest Rate
6.59%
Mortgage Type
FHA
Create a Home Valuation Report for This Property
The Home Valuation Report is an in-depth analysis detailing your home's value as well as a comparison with similar homes in the area
Home Values in the Area
Average Home Value in this Area
Purchase History
| Date | Buyer | Sale Price | Title Company |
|---|---|---|---|
| Burgess Chad A | -- | -- | |
| Dykmann Robert C | -- | Chicago Title Insurance Comp | |
| Meglemre Theodore M | -- | Guarantee Title |
Source: Public Records
Mortgage History
| Date | Status | Borrower | Loan Amount |
|---|---|---|---|
| Previous Owner | Dykmann Robert C | $100,000 | |
| Previous Owner | Meglemre Theodore M | $114,948 |
Source: Public Records
Tax History Compared to Growth
Tax History
| Year | Tax Paid | Tax Assessment Tax Assessment Total Assessment is a certain percentage of the fair market value that is determined by local assessors to be the total taxable value of land and additions on the property. | Land | Improvement |
|---|---|---|---|---|
| 2024 | $2,995 | $27,301 | $5,058 | $22,243 |
| 2023 | $3,061 | $27,151 | $4,594 | $22,557 |
| 2022 | $2,810 | $24,887 | $4,175 | $20,712 |
| 2021 | $2,667 | $22,264 | $3,971 | $18,293 |
| 2020 | $2,471 | $20,390 | $3,609 | $16,781 |
| 2019 | $2,360 | $19,447 | $3,010 | $16,437 |
| 2018 | $2,292 | $18,711 | $3,010 | $15,701 |
| 2017 | $2,160 | $17,066 | $2,751 | $14,315 |
| 2016 | $2,011 | $15,663 | $2,751 | $12,912 |
| 2015 | $1,867 | $14,617 | $2,751 | $11,866 |
| 2013 | -- | $14,456 | $2,751 | $11,705 |
Source: Public Records
Map
Nearby Homes
- 13017 W 92nd St
- 12894 W 93rd St
- 13312 W 91st St
- 9948 Rosehill Rd
- 10184 Haskins St
- 13013 W 101st St
- 12122 W 92nd St
- 9029 Acuff Ln
- 13300 W 102nd St
- 9318 Greenway Ln
- 14101 W 88th Place
- 9202 Greenway Ln
- 10211 Hauser St
- 10220 Gillette St
- 10226 Gillette St
- 12022 W 100th St
- 9131 Darnell St
- 8919 Greenway Ln
- 10107 Monrovia St
- 12207 W 101st Terrace
- 9450 Haskins St
- 9436 Haskins St
- 13313 W 94th Terrace
- 13300 W 95th St
- 9435 Haskins St
- 13222 W 95th St
- 13405 W 94th Terrace
- 13404 W 95th St
- 13308 W 94th Terrace
- 9421 Haskins St
- 9416 Haskins St
- 13216 W 95th St
- 13400 W 94th Terrace
- 9500 Haskins St
- 13409 W 94th Terrace
- 9413 Haskins St
- 13223 W 95th St
- 13404 W 94th Terrace
- 9410 Haskins St
- 13401 W 95th St