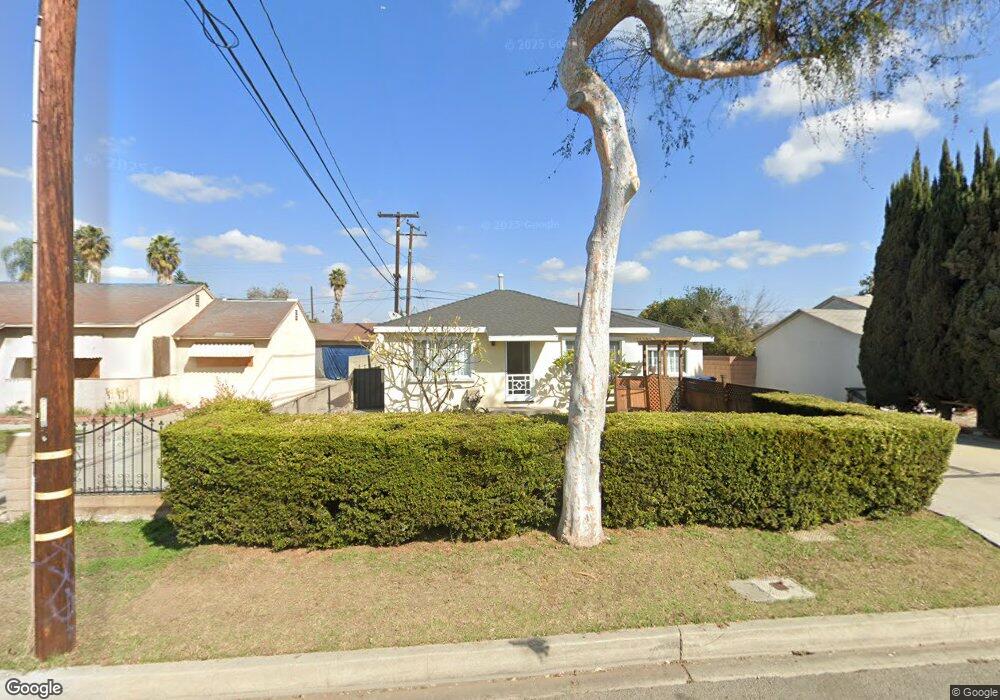
9441 Dicky St Pico Rivera, CA 90660
Estimated Value: $703,000 - $716,000
3
Beds
1
Bath
1,083
Sq Ft
$657/Sq Ft
Est. Value
About This Home
This home is located at 9441 Dicky St, Pico Rivera, CA 90660 and is currently estimated at $711,954, approximately $657 per square foot. 9441 Dicky St is a home located in Los Angeles County with nearby schools including Valencia Academy of the Arts, Ruben Salazar Continuation School, and El Rancho High School.
Ownership History
Date
Name
Owned For
Owner Type
Purchase Details
Closed on
Oct 5, 2022
Sold by
Corona Javier E
Bought by
Corona 2022 Joint Revocable Trust and Corona
Current Estimated Value
Purchase Details
Closed on
Apr 15, 2016
Sold by
Corona Javier E
Bought by
Corona Javier E
Home Financials for this Owner
Home Financials are based on the most recent Mortgage that was taken out on this home.
Original Mortgage
$304,000
Interest Rate
3.68%
Mortgage Type
New Conventional
Purchase Details
Closed on
May 24, 2004
Sold by
Nevarez Charles M and Nevarez Vivian G
Bought by
Corona Javier E
Home Financials for this Owner
Home Financials are based on the most recent Mortgage that was taken out on this home.
Original Mortgage
$231,000
Interest Rate
5.75%
Mortgage Type
Purchase Money Mortgage
Create a Home Valuation Report for This Property
The Home Valuation Report is an in-depth analysis detailing your home's value as well as a comparison with similar homes in the area
Home Values in the Area
Average Home Value in this Area
Purchase History
| Date | Buyer | Sale Price | Title Company |
|---|---|---|---|
| Corona 2022 Joint Revocable Trust | -- | None Listed On Document | |
| Corona Javier E | -- | Title 365 | |
| Corona Javier E | -- | Title 365 | |
| Corona Javier E | $330,000 | Fidelity National |
Source: Public Records
Mortgage History
| Date | Status | Borrower | Loan Amount |
|---|---|---|---|
| Previous Owner | Corona Javier E | $304,000 | |
| Previous Owner | Corona Javier E | $231,000 | |
| Closed | Corona Javier E | $66,000 |
Source: Public Records
Tax History
| Year | Tax Paid | Tax Assessment Tax Assessment Total Assessment is a certain percentage of the fair market value that is determined by local assessors to be the total taxable value of land and additions on the property. | Land | Improvement |
|---|---|---|---|---|
| 2025 | $6,411 | $459,971 | $341,779 | $118,192 |
| 2024 | $6,411 | $450,953 | $335,078 | $115,875 |
| 2023 | $6,234 | $442,111 | $328,508 | $113,603 |
| 2022 | $5,953 | $433,443 | $322,067 | $111,376 |
| 2021 | $5,824 | $424,945 | $315,752 | $109,193 |
| 2019 | $5,796 | $412,343 | $306,388 | $105,955 |
| 2018 | $5,536 | $404,259 | $300,381 | $103,878 |
| 2016 | $4,996 | $388,564 | $288,718 | $99,846 |
| 2015 | $4,687 | $362,000 | $269,000 | $93,000 |
| 2014 | $4,707 | $362,000 | $269,000 | $93,000 |
Source: Public Records
Map
Nearby Homes
- 9514 Bradhurst St
- 9324 Rosehedge Dr
- 6651 Via Vista
- 6650 Via Vista
- 6630 Via Vista
- 6648 Via Vista
- 9243 Balfour St
- 6805 Pioneer Blvd
- 9203 Loch Lomond Dr
- 10550 Dunlap Crossing Rd
- 10550 Dunlap Crossing Rd Unit 27
- 9530 Underwood St
- 10512 Rose Hedge Dr
- 5313 Manzanar Ave
- 5101 Lindsey Ave
- 10704 Balfour St
- 7019 Passons Blvd
- 7021 Passons Blvd
- 7406 Norwalk Blvd
- 5259 Calico Ave
Your Personal Tour Guide
Ask me questions while you tour the home.