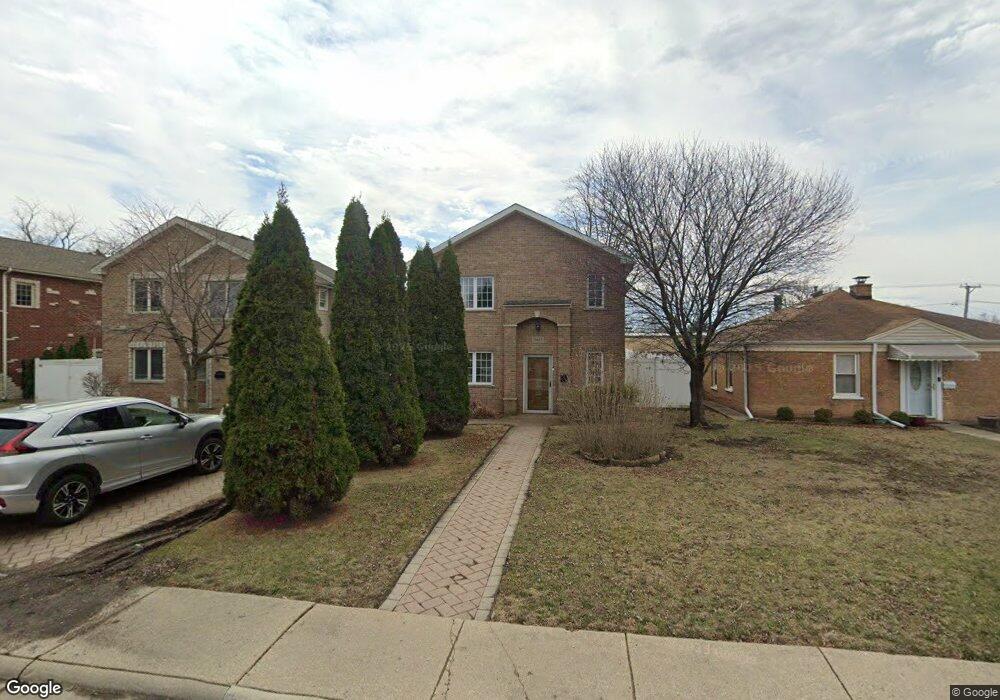
9443 Nerbonne Ave Unit 5 Franklin Park, IL 60131
Estimated Value: $378,000 - $408,080
3
Beds
3
Baths
1,677
Sq Ft
$235/Sq Ft
Est. Value
About This Home
This home is located at 9443 Nerbonne Ave Unit 5, Franklin Park, IL 60131 and is currently estimated at $394,770, approximately $235 per square foot. 9443 Nerbonne Ave Unit 5 is a home located in Cook County with nearby schools including North Elementary School, Hester Jr High School, and East Leyden High School.
Ownership History
Date
Name
Owned For
Owner Type
Purchase Details
Closed on
Jan 26, 2011
Sold by
Mohammed Saleem and Mohammed Saleema
Bought by
Nguyen Quang Dinh and Lam Tam
Current Estimated Value
Home Financials for this Owner
Home Financials are based on the most recent Mortgage that was taken out on this home.
Original Mortgage
$205,163
Outstanding Balance
$140,987
Interest Rate
4.87%
Mortgage Type
FHA
Estimated Equity
$253,783
Purchase Details
Closed on
Aug 12, 2010
Sold by
Dohotar Ioan Marius
Bought by
Mohammed Saleem
Purchase Details
Closed on
Nov 18, 2004
Sold by
Stasik Grzegorz and Dudzik Dorota
Bought by
Dohotar Ioan Marius
Home Financials for this Owner
Home Financials are based on the most recent Mortgage that was taken out on this home.
Original Mortgage
$189,050
Interest Rate
8.5%
Mortgage Type
Unknown
Purchase Details
Closed on
Sep 12, 2000
Sold by
Dreyer Trevor C
Bought by
Stasik Grzegorz and Dudzik Dorota
Home Financials for this Owner
Home Financials are based on the most recent Mortgage that was taken out on this home.
Original Mortgage
$128,937
Interest Rate
7.87%
Mortgage Type
FHA
Create a Home Valuation Report for This Property
The Home Valuation Report is an in-depth analysis detailing your home's value as well as a comparison with similar homes in the area
Home Values in the Area
Average Home Value in this Area
Purchase History
| Date | Buyer | Sale Price | Title Company |
|---|---|---|---|
| Nguyen Quang Dinh | $210,500 | Git | |
| Mohammed Saleem | $120,000 | None Available | |
| Dohotar Ioan Marius | $199,000 | Multiple | |
| Stasik Grzegorz | $130,000 | -- |
Source: Public Records
Mortgage History
| Date | Status | Borrower | Loan Amount |
|---|---|---|---|
| Open | Nguyen Quang Dinh | $205,163 | |
| Previous Owner | Dohotar Ioan Marius | $189,050 | |
| Previous Owner | Stasik Grzegorz | $128,937 |
Source: Public Records
Tax History Compared to Growth
Tax History
| Year | Tax Paid | Tax Assessment Tax Assessment Total Assessment is a certain percentage of the fair market value that is determined by local assessors to be the total taxable value of land and additions on the property. | Land | Improvement |
|---|---|---|---|---|
| 2024 | $8,502 | $31,001 | $5,468 | $25,533 |
| 2023 | $8,740 | $31,001 | $5,468 | $25,533 |
| 2022 | $8,740 | $31,001 | $5,468 | $25,533 |
| 2021 | $6,197 | $18,976 | $3,948 | $15,028 |
| 2020 | $5,982 | $18,976 | $3,948 | $15,028 |
| 2019 | $6,241 | $21,442 | $3,948 | $17,494 |
| 2018 | $8,285 | $23,969 | $3,341 | $20,628 |
| 2017 | $8,190 | $23,969 | $3,341 | $20,628 |
| 2016 | $7,937 | $23,969 | $3,341 | $20,628 |
| 2015 | $7,225 | $21,127 | $3,037 | $18,090 |
| 2014 | $7,055 | $21,127 | $3,037 | $18,090 |
| 2013 | $7,445 | $21,127 | $3,037 | $18,090 |
Source: Public Records
Map
Nearby Homes
- 9504 Nerbonne Ave
- 3340 Pearl St
- 3321 Ruby St
- 3421 Elder Ln
- 3721 Ruby St Unit 103S
- 3706 Ruby St
- 3848 25th Ave Unit 38485
- 3709 Emerson St
- 9770 Ivanhoe Ave
- 3623 Hawthorne St
- 3652 Hawthorne St
- 3821 Emerson Dr
- 3507 Louis St
- 3515 Louis St
- 3519 Louis St
- 9044 Walnut Ave
- 9202 Seymour Ave
- 4008 Wagner Ave
- 4012 Wagner Ave
- 9355 Irving Park Rd Unit 208
- 9441 Nerbonne Ave
- 9501 Nerbonne Ave
- 9439 Nerbonne Ave
- 9505 Nerbonne Ave
- 9435 Nerbonne Ave
- 9509 Nerbonne Ave
- 9433 Nerbonne Ave
- 9515 Nerbonne Ave
- 9442 Nerbonne Ave
- 9502 Nerbonne Ave
- 9440 Nerbonne Ave
- 9438 Nerbonne Ave
- 9431 Nerbonne Ave
- 9517 Nerbonne Ave
- 9434 Nerbonne Ave
- 9510 Nerbonne Ave
- 9519 Nerbonne Ave
- 9432 Nerbonne Ave
- 9514 Nerbonne Ave
- 9429 Nerbonne Ave