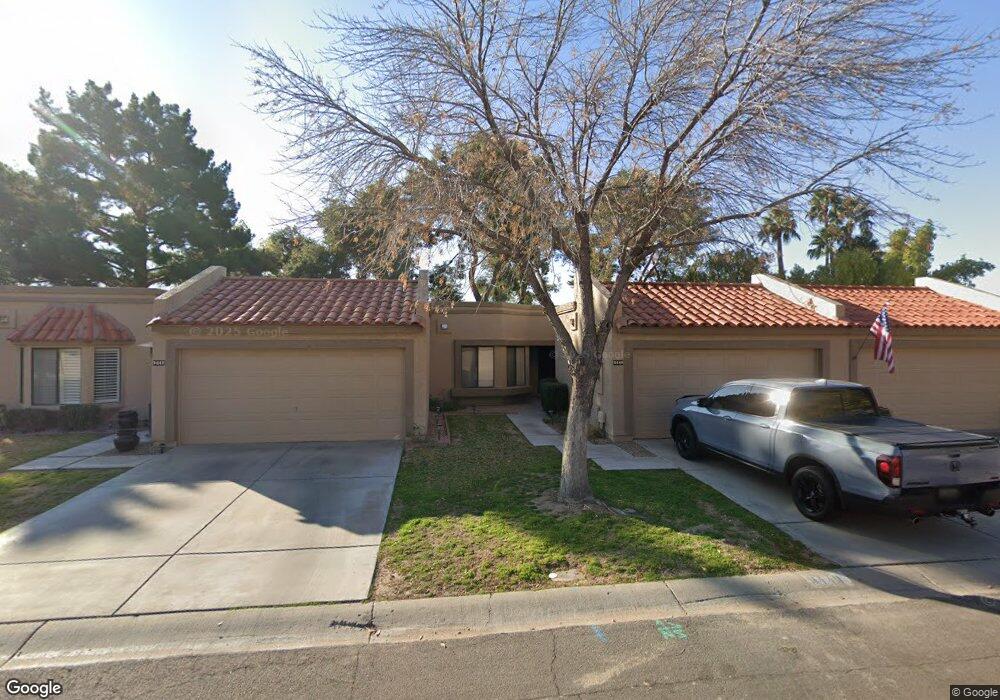
9449 W Mcrae Way Unit 45 Peoria, AZ 85382
Estimated Value: $287,977 - $340,000
2
Beds
2
Baths
1,291
Sq Ft
$249/Sq Ft
Est. Value
About This Home
This home is located at 9449 W Mcrae Way Unit 45, Peoria, AZ 85382 and is currently estimated at $321,244, approximately $248 per square foot. 9449 W Mcrae Way Unit 45 is a home located in Maricopa County with nearby schools including Apache Elementary School, Sunrise Mountain High School, and Sonoran Science Academy-Peoria.
Ownership History
Date
Name
Owned For
Owner Type
Purchase Details
Closed on
Dec 29, 2015
Sold by
Mcmellen Amy D
Bought by
Mcmellen Amy D and The Amy D Mcmellen Living Trust
Current Estimated Value
Purchase Details
Closed on
Jun 3, 2011
Sold by
Baerny Dennis
Bought by
Mcmellen Amy
Home Financials for this Owner
Home Financials are based on the most recent Mortgage that was taken out on this home.
Original Mortgage
$97,200
Outstanding Balance
$66,755
Interest Rate
4.55%
Mortgage Type
New Conventional
Estimated Equity
$254,489
Purchase Details
Closed on
Feb 15, 2004
Sold by
Chase Donald P and Emery Carol A
Bought by
Hunt Mary Ellen Segrave
Home Financials for this Owner
Home Financials are based on the most recent Mortgage that was taken out on this home.
Original Mortgage
$87,200
Interest Rate
5.61%
Mortgage Type
New Conventional
Create a Home Valuation Report for This Property
The Home Valuation Report is an in-depth analysis detailing your home's value as well as a comparison with similar homes in the area
Home Values in the Area
Average Home Value in this Area
Purchase History
| Date | Buyer | Sale Price | Title Company |
|---|---|---|---|
| Mcmellen Amy D | -- | None Available | |
| Mcmellen Amy | $108,000 | American Title Service Agenc | |
| Hunt Mary Ellen Segrave | $109,000 | First American Title Ins Co |
Source: Public Records
Mortgage History
| Date | Status | Borrower | Loan Amount |
|---|---|---|---|
| Open | Mcmellen Amy | $97,200 | |
| Previous Owner | Hunt Mary Ellen Segrave | $87,200 |
Source: Public Records
Tax History Compared to Growth
Tax History
| Year | Tax Paid | Tax Assessment Tax Assessment Total Assessment is a certain percentage of the fair market value that is determined by local assessors to be the total taxable value of land and additions on the property. | Land | Improvement |
|---|---|---|---|---|
| 2025 | $1,208 | $15,513 | -- | -- |
| 2024 | $1,189 | $14,774 | -- | -- |
| 2023 | $1,189 | $22,770 | $4,550 | $18,220 |
| 2022 | $1,165 | $18,680 | $3,730 | $14,950 |
| 2021 | $1,247 | $19,150 | $3,830 | $15,320 |
| 2020 | $1,259 | $17,420 | $3,480 | $13,940 |
| 2019 | $1,218 | $15,410 | $3,080 | $12,330 |
| 2018 | $1,178 | $14,120 | $2,820 | $11,300 |
| 2017 | $1,178 | $11,960 | $2,390 | $9,570 |
| 2016 | $1,166 | $11,050 | $2,210 | $8,840 |
| 2015 | $1,088 | $10,750 | $2,150 | $8,600 |
Source: Public Records
Map
Nearby Homes
- 9441 W Morrow Dr Unit 9
- 9505 W Mcrae Way Unit 39
- 9512 W Mcrae Way
- 18804 N 95th Ave Unit 19
- 18778 N 94th Ave
- 19025 N 96th Ave
- 9270 W Morrow Dr
- 9273 W Jason Dr Unit 73
- 9237 W Kimberly Way
- 18725 N 92nd Dr Unit 104
- 9535 W Willowbrook Dr
- 9622 W Taro Ln
- 9526 W Country Club Dr
- 9646 W Taro Ln
- 9631 W Spanish Moss Ln
- 18823 N 97th Ln
- 9635 W Spanish Moss Ln
- 9603 W Country Club Dr
- 18650 N 91st Ave Unit 4001
- 18650 N 91st Ave Unit 1401
- 9451 W Mcrae Way Unit 44
- 9447 W Mcrae Way Unit 46
- 9453 W Mcrae Way
- 9443 W Mcrae Way
- 9455 W Mcrae Way Unit 42
- 9446 W Mcrae Way
- 9446 W Mcrae Way Unit 21
- 9441 W Mcrae Way Unit 48
- 9441 W Mcrae Way
- 9448 W Mcrae Way Unit 48
- 9448 W Mcrae Way
- 9450 W Mcrae Way Unit 19
- 9444 W Mcrae Way Unit 22
- 9442 W Mcrae Way Unit 23
- 9501 W Mcrae Way Unit 41
- 9439 W Mcrae Way Unit 49
- 9500 W Mcrae Way Unit 18
- 9440 W Mcrae Way
- 9503 W Mcrae Way
- 9502 W Mcrae Way