945 25th St Marion, IA 52302
Estimated Value: $169,000 - $193,000
3
Beds
2
Baths
1,064
Sq Ft
$168/Sq Ft
Est. Value
About This Home
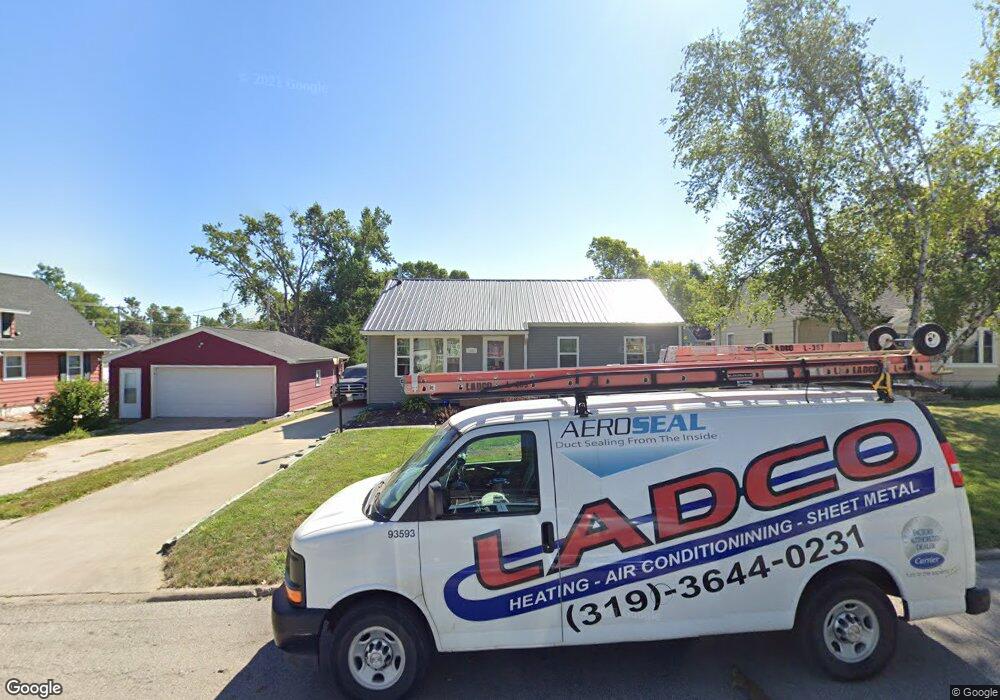
This home is located at 945 25th St, Marion, IA 52302 and is currently estimated at $178,764, approximately $168 per square foot. 945 25th St is a home located in Linn County with nearby schools including Francis Marion Intermediate School, Vernon Middle School, and Marion High School.
Ownership History
Date
Name
Owned For
Owner Type
Purchase Details
Closed on
Jul 24, 2002
Sold by
Barnard Young Larry L and Barnard Young Charlene A
Bought by
Renfer John G
Current Estimated Value
Home Financials for this Owner
Home Financials are based on the most recent Mortgage that was taken out on this home.
Original Mortgage
$66,400
Outstanding Balance
$28,328
Interest Rate
6.8%
Estimated Equity
$150,436
Create a Home Valuation Report for This Property
The Home Valuation Report is an in-depth analysis detailing your home's value as well as a comparison with similar homes in the area
Home Values in the Area
Average Home Value in this Area
Purchase History
| Date | Buyer | Sale Price | Title Company |
|---|---|---|---|
| Renfer John G | $84,000 | -- |
Source: Public Records
Mortgage History
| Date | Status | Borrower | Loan Amount |
|---|---|---|---|
| Open | Renfer John G | $66,400 | |
| Closed | Renfer John G | $16,500 |
Source: Public Records
Tax History Compared to Growth
Tax History
| Year | Tax Paid | Tax Assessment Tax Assessment Total Assessment is a certain percentage of the fair market value that is determined by local assessors to be the total taxable value of land and additions on the property. | Land | Improvement |
|---|---|---|---|---|
| 2025 | $2,862 | $174,200 | $16,400 | $157,800 |
| 2024 | $2,706 | $163,000 | $16,400 | $146,600 |
| 2023 | $2,706 | $163,000 | $16,400 | $146,600 |
| 2022 | $2,612 | $130,500 | $16,400 | $114,100 |
| 2021 | $2,374 | $130,500 | $16,400 | $114,100 |
| 2020 | $2,374 | $113,600 | $16,400 | $97,200 |
| 2019 | $2,222 | $107,100 | $16,400 | $90,700 |
| 2018 | $2,130 | $107,100 | $16,400 | $90,700 |
| 2017 | $2,146 | $103,600 | $16,400 | $87,200 |
| 2016 | $2,306 | $103,600 | $16,400 | $87,200 |
| 2015 | $2,295 | $103,600 | $16,400 | $87,200 |
| 2014 | $2,102 | $103,600 | $16,400 | $87,200 |
| 2013 | $2,018 | $103,600 | $16,400 | $87,200 |
Source: Public Records
Map
Nearby Homes