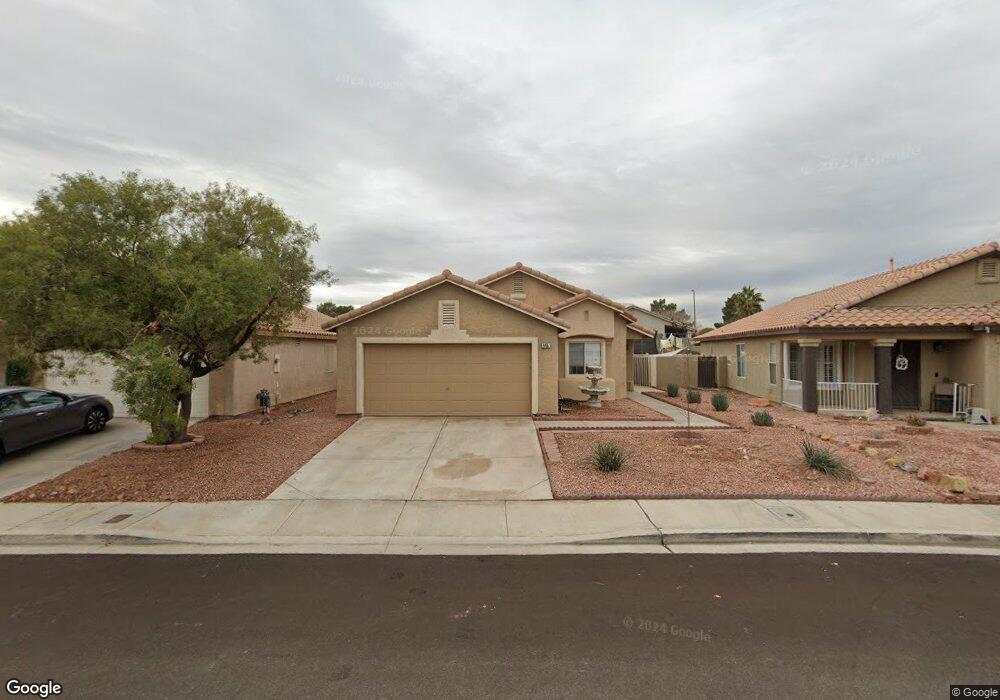
945 Cedar Pines St Unit B1 Henderson, NV 89011
South Valley Ranch NeighborhoodEstimated Value: $366,148 - $400,000
3
Beds
2
Baths
1,321
Sq Ft
$290/Sq Ft
Est. Value
About This Home
This home is located at 945 Cedar Pines St Unit B1, Henderson, NV 89011 and is currently estimated at $383,037, approximately $289 per square foot. 945 Cedar Pines St Unit B1 is a home located in Clark County with nearby schools including Josh Stevens Elementary School, Francis H Cortney Junior High School, and Basic Academy of International Studies.
Ownership History
Date
Name
Owned For
Owner Type
Purchase Details
Closed on
Mar 26, 2013
Sold by
Brown Richard C
Bought by
Polos Susan L
Current Estimated Value
Purchase Details
Closed on
Mar 6, 2007
Sold by
Polos Susan L
Bought by
Brown Richard C
Purchase Details
Closed on
Mar 24, 2004
Sold by
Kalambakal Laurel V and Kalambakal Patti L
Bought by
Polos Susan L
Home Financials for this Owner
Home Financials are based on the most recent Mortgage that was taken out on this home.
Original Mortgage
$163,920
Interest Rate
5.37%
Mortgage Type
Unknown
Purchase Details
Closed on
May 28, 1997
Sold by
Greystone Homes Inc
Bought by
Kalambakal Laurel and Kalambakal Patti L
Home Financials for this Owner
Home Financials are based on the most recent Mortgage that was taken out on this home.
Original Mortgage
$94,300
Interest Rate
8.13%
Create a Home Valuation Report for This Property
The Home Valuation Report is an in-depth analysis detailing your home's value as well as a comparison with similar homes in the area
Home Values in the Area
Average Home Value in this Area
Purchase History
| Date | Buyer | Sale Price | Title Company |
|---|---|---|---|
| Polos Susan L | -- | None Available | |
| Brown Richard C | -- | None Available | |
| Polos Susan L | $204,900 | United Title Of Nevada | |
| Kalambakal Laurel | $111,000 | Nevada Title Company |
Source: Public Records
Mortgage History
| Date | Status | Borrower | Loan Amount |
|---|---|---|---|
| Previous Owner | Polos Susan L | $163,920 | |
| Previous Owner | Kalambakal Laurel | $94,300 |
Source: Public Records
Tax History Compared to Growth
Tax History
| Year | Tax Paid | Tax Assessment Tax Assessment Total Assessment is a certain percentage of the fair market value that is determined by local assessors to be the total taxable value of land and additions on the property. | Land | Improvement |
|---|---|---|---|---|
| 2025 | $1,180 | $81,778 | $31,150 | $50,628 |
| 2024 | $1,146 | $81,778 | $31,150 | $50,628 |
| 2023 | $935 | $77,449 | $29,400 | $48,049 |
| 2022 | $1,167 | $68,914 | $24,850 | $44,064 |
| 2021 | $1,130 | $63,624 | $21,700 | $41,924 |
| 2020 | $1,046 | $63,392 | $21,700 | $41,692 |
| 2019 | $1,033 | $60,062 | $18,900 | $41,162 |
| 2018 | $986 | $55,108 | $15,400 | $39,708 |
| 2017 | $1,533 | $52,878 | $12,600 | $40,278 |
| 2016 | $935 | $48,583 | $9,800 | $38,783 |
| 2015 | $934 | $38,005 | $8,050 | $29,955 |
| 2014 | $905 | $30,303 | $6,125 | $24,178 |
Source: Public Records
Map
Nearby Homes
- 949 Adobe Flat Dr
- 833 Aspen Peak Loop Unit 1026
- 833 Aspen Peak Loop Unit 121
- 833 Aspen Peak Loop Unit 712
- 833 Aspen Peak Loop Unit 1524
- 833 Aspen Peak Loop Unit 814
- 833 Aspen Peak Loop Unit 613
- 833 Aspen Peak Loop Unit 2613
- 661 Saloon Ct Unit AI
- 740 Moonlight Mesa Dr
- 1013 Adobe Flat Dr
- 733 Hitchen Post Dr
- 821 Tollbrook Way
- 1065 Blue Sands Ct
- 624 Black Sand Ct
- 828 Angelus Oaks Dr
- 672 Hitchen Post Dr
- 608 Black Sand Ct
- 648 Hitchen Post Dr Unit DII
- 632 Hitchen Post Dr
- 941 Cedar Pines St
- 949 Cedar Pines St
- 937 Cedar Pines St Unit BI
- 953 Cedar Pines St
- 940 Skyforest Dr
- 944 Skyforest Dr
- 936 Skyforest Dr
- 948 Skyforest Dr
- 933 Cedar Pines St
- 957 Cedar Pines St
- 732 Orchid Tree Ln
- 932 Skyforest Dr
- 737 Oak Field Ln
- 952 Skyforest Dr
- 929 Cedar Pines St Unit B1
- 956 Skyforest Dr
- 928 Skyforest Dr
- 961 Cedar Pines St
- 733 Oak Field Ln
- 728 Orchid Tree Ln