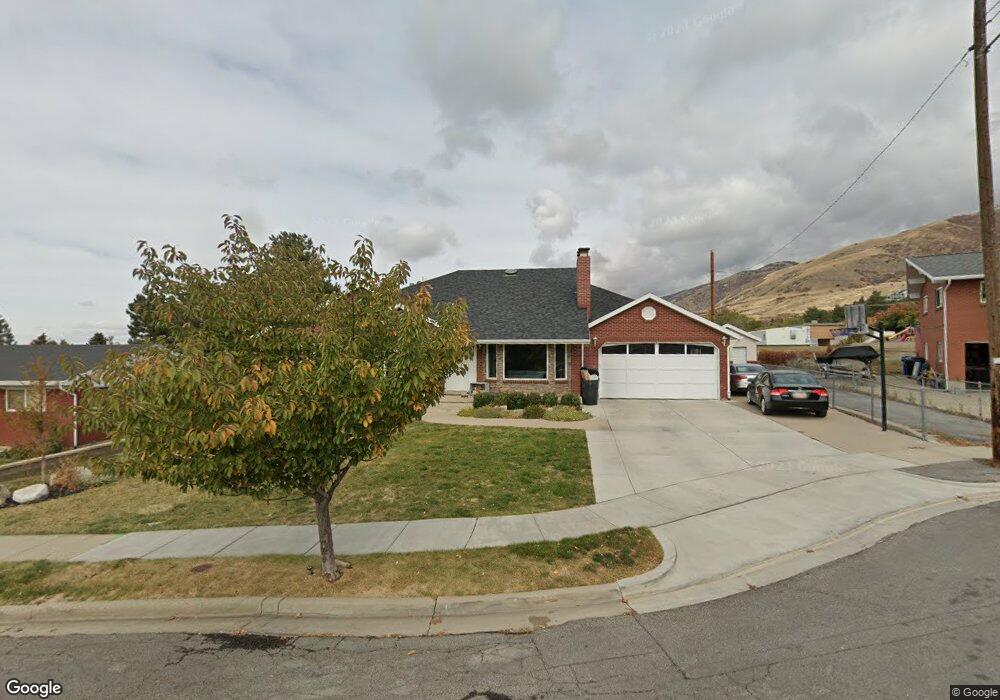
945 E 75 N Bountiful, UT 84010
Estimated Value: $589,000 - $783,903
--
Bed
4
Baths
2,321
Sq Ft
$307/Sq Ft
Est. Value
About This Home
This home is located at 945 E 75 N, Bountiful, UT 84010 and is currently estimated at $711,976, approximately $306 per square foot. 945 E 75 N is a home located in Davis County with nearby schools including Holbrook Elementary School, Millcreek Junior High School, and Bountiful High School.
Ownership History
Date
Name
Owned For
Owner Type
Purchase Details
Closed on
Aug 20, 2021
Sold by
Cline Austin and Cline Charity
Bought by
Cline Austin and Cline Charity
Current Estimated Value
Home Financials for this Owner
Home Financials are based on the most recent Mortgage that was taken out on this home.
Original Mortgage
$301,250
Outstanding Balance
$273,930
Interest Rate
2.9%
Mortgage Type
New Conventional
Estimated Equity
$438,046
Purchase Details
Closed on
Aug 19, 2021
Sold by
Cole Cliff R
Bought by
Cline Austin and Cline Charity
Home Financials for this Owner
Home Financials are based on the most recent Mortgage that was taken out on this home.
Original Mortgage
$301,250
Outstanding Balance
$273,930
Interest Rate
2.9%
Mortgage Type
New Conventional
Estimated Equity
$438,046
Purchase Details
Closed on
Feb 26, 2003
Sold by
Cole Cliff R and Cole Ruth P
Bought by
Cole Cliff R
Home Financials for this Owner
Home Financials are based on the most recent Mortgage that was taken out on this home.
Original Mortgage
$140,100
Interest Rate
5.33%
Purchase Details
Closed on
Jan 28, 2002
Sold by
Young Scott J and Young Rozanne W
Bought by
Cole Cliff R and Cole Ruth P
Home Financials for this Owner
Home Financials are based on the most recent Mortgage that was taken out on this home.
Original Mortgage
$160,000
Interest Rate
7.17%
Purchase Details
Closed on
Jan 16, 2002
Sold by
Mangelson Gary C and Mangelson Susan W
Bought by
Young Scott J and Young Rozanne W
Home Financials for this Owner
Home Financials are based on the most recent Mortgage that was taken out on this home.
Original Mortgage
$160,000
Interest Rate
7.17%
Purchase Details
Closed on
Jul 6, 2001
Sold by
Young Scott J and Young Rozanne W
Bought by
Mangelson Gary C and Mangelson Susan W
Home Financials for this Owner
Home Financials are based on the most recent Mortgage that was taken out on this home.
Original Mortgage
$166,250
Interest Rate
7.26%
Purchase Details
Closed on
Jun 1, 2001
Sold by
Youngberg Michael C and Youngberg Donna G
Bought by
Hammer Tod
Home Financials for this Owner
Home Financials are based on the most recent Mortgage that was taken out on this home.
Original Mortgage
$166,250
Interest Rate
7.26%
Create a Home Valuation Report for This Property
The Home Valuation Report is an in-depth analysis detailing your home's value as well as a comparison with similar homes in the area
Purchase History
| Date | Buyer | Sale Price | Title Company |
|---|---|---|---|
| Cline Austin | -- | Aspen Title Insurance | |
| Cline Austin | -- | Aspen Title Insurance | |
| Cole Cliff R | -- | Sundance Title Agency | |
| Cole Cliff R | -- | Aspen Title Insurance Agency | |
| Young Scott J | -- | -- | |
| Mangelson Gary C | -- | Aspen Title Insurance Agency | |
| Hammer Tod | -- | Aspen Title Insurance Agency |
Source: Public Records
Mortgage History
| Date | Status | Borrower | Loan Amount |
|---|---|---|---|
| Open | Cline Austin | $301,250 | |
| Previous Owner | Cole Cliff R | $140,100 | |
| Previous Owner | Cole Cliff R | $160,000 | |
| Previous Owner | Mangelson Gary C | $166,250 |
Source: Public Records
Tax History
| Year | Tax Paid | Tax Assessment Tax Assessment Total Assessment is a certain percentage of the fair market value that is determined by local assessors to be the total taxable value of land and additions on the property. | Land | Improvement |
|---|---|---|---|---|
| 2025 | $4,404 | $408,100 | $139,358 | $268,742 |
| 2024 | $4,124 | $393,800 | $128,402 | $265,398 |
| 2023 | $3,995 | $692,000 | $233,946 | $458,054 |
| 2022 | $4,109 | $390,500 | $124,732 | $265,768 |
| 2021 | $3,528 | $512,000 | $185,483 | $326,517 |
| 2020 | $3,129 | $456,000 | $168,868 | $287,132 |
| 2019 | $3,101 | $441,000 | $163,841 | $277,159 |
| 2018 | $2,953 | $414,000 | $152,537 | $261,463 |
| 2016 | $2,674 | $203,555 | $49,725 | $153,830 |
| 2015 | $2,732 | $196,900 | $49,725 | $147,175 |
| 2014 | $2,468 | $181,852 | $49,725 | $132,127 |
| 2013 | -- | $175,846 | $57,728 | $118,118 |
Source: Public Records
Map
Nearby Homes
- 6 N 800 E
- 129 N 800 E
- 683 E 100 N
- 1138 Briggs Dr
- 908 Northern Hills Dr Unit 3
- 513 N 400 E Unit 14B
- 933 Northern Hills Cir
- 456 E 500 S
- 453 N 400 E Unit 7-D
- 520 S Orchard Dr Unit 17
- 255 E 400 S
- 275 E Peach Ln S
- 323 Peach Ln
- 331 S 1550 E Unit 3
- 1342 E Skyline Dr N Unit 30
- 357 S 100 E
- 861 E Millbrook Way
- 49 E 200 N Unit 4
- 41 E 200 N Unit 6
- 144 Bountiful Blvd
Your Personal Tour Guide
Ask me questions while you tour the home.