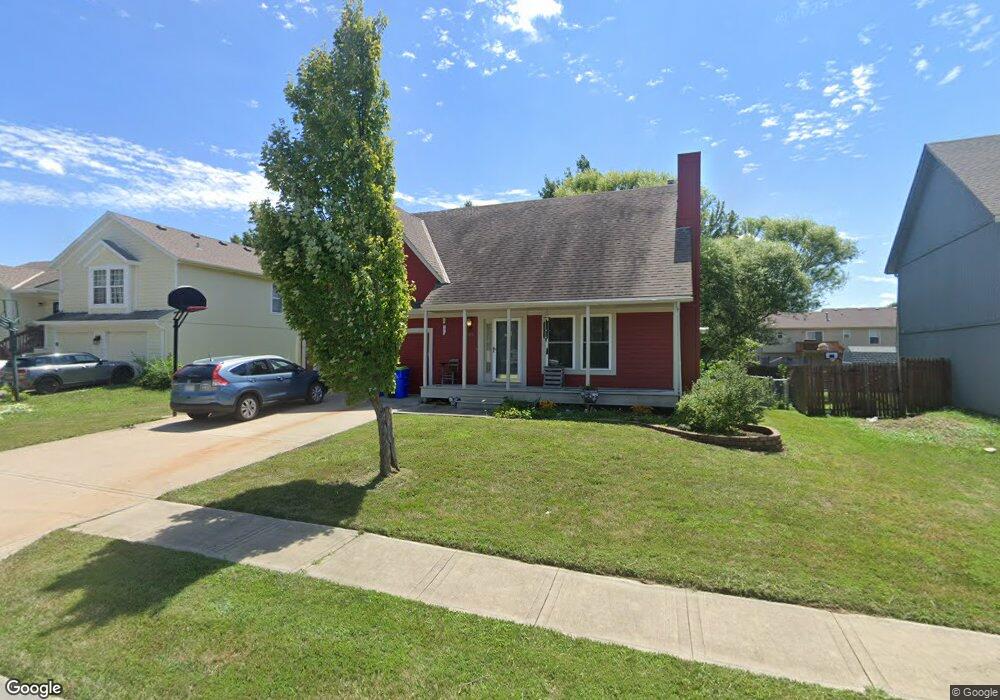
945 E Cottage Creek Dr Gardner, KS 66030
Gardner-Edgerton NeighborhoodEstimated Value: $320,000 - $391,000
4
Beds
4
Baths
1,666
Sq Ft
$209/Sq Ft
Est. Value
About This Home
This home is located at 945 E Cottage Creek Dr, Gardner, KS 66030 and is currently estimated at $348,390, approximately $209 per square foot. 945 E Cottage Creek Dr is a home located in Johnson County with nearby schools including Moonlight Elementary School, Trail Ridge Middle School, and Gardner Edgerton High School.
Ownership History
Date
Name
Owned For
Owner Type
Purchase Details
Closed on
Feb 2, 2024
Sold by
Chambers Kevin
Bought by
Chambers Brandi
Current Estimated Value
Purchase Details
Closed on
Jan 31, 2024
Sold by
Chambers Kevin
Bought by
Chambers Brandi
Purchase Details
Closed on
Aug 1, 2007
Sold by
Lasalle Bank Na
Bought by
Chambers Kevin M and Chambers Brandi
Home Financials for this Owner
Home Financials are based on the most recent Mortgage that was taken out on this home.
Original Mortgage
$121,800
Interest Rate
6.64%
Mortgage Type
New Conventional
Purchase Details
Closed on
Aug 3, 2006
Sold by
Haring Robert F and Crofta Tabitha L
Bought by
Emc Mortgage Corp
Purchase Details
Closed on
Jun 14, 2004
Sold by
Smith Richard I and Smith Janet I
Bought by
Haring Robert F and Croft Tabitha I
Home Financials for this Owner
Home Financials are based on the most recent Mortgage that was taken out on this home.
Original Mortgage
$128,000
Interest Rate
7.5%
Mortgage Type
Unknown
Create a Home Valuation Report for This Property
The Home Valuation Report is an in-depth analysis detailing your home's value as well as a comparison with similar homes in the area
Home Values in the Area
Average Home Value in this Area
Purchase History
| Date | Buyer | Sale Price | Title Company |
|---|---|---|---|
| Chambers Brandi | -- | None Listed On Document | |
| Chambers Brandi | -- | None Listed On Document | |
| Chambers Brandi | -- | None Listed On Document | |
| Chambers Kevin M | -- | Continental Title Company | |
| Emc Mortgage Corp | $137,700 | Continental Title | |
| Haring Robert F | -- | Chicago Title Ins Co |
Source: Public Records
Mortgage History
| Date | Status | Borrower | Loan Amount |
|---|---|---|---|
| Previous Owner | Chambers Kevin M | $121,800 | |
| Previous Owner | Haring Robert F | $128,000 | |
| Closed | Haring Robert F | $32,000 |
Source: Public Records
Tax History
| Year | Tax Paid | Tax Assessment Tax Assessment Total Assessment is a certain percentage of the fair market value that is determined by local assessors to be the total taxable value of land and additions on the property. | Land | Improvement |
|---|---|---|---|---|
| 2025 | $4,438 | $38,548 | $6,894 | $31,654 |
| 2024 | $4,438 | $36,282 | $6,894 | $29,388 |
| 2023 | $4,419 | $35,098 | $6,272 | $28,826 |
| 2022 | $3,996 | $31,418 | $5,636 | $25,782 |
| 2021 | $3,769 | $28,405 | $4,905 | $23,500 |
| 2020 | $3,209 | $23,667 | $4,905 | $18,762 |
| 2019 | $2,982 | $22,333 | $4,292 | $18,041 |
| 2018 | $2,825 | $22,528 | $4,288 | $18,240 |
| 2017 | $2,877 | $21,137 | $3,732 | $17,405 |
| 2016 | $2,741 | $19,987 | $3,732 | $16,255 |
| 2015 | $2,577 | $19,090 | $3,732 | $15,358 |
| 2013 | -- | $16,480 | $3,732 | $12,748 |
Source: Public Records
Map
Nearby Homes
- 409 Pumpkin Ridge Cir
- 573 Woodson Ln
- 962 E Wildcat Run St
- 565 S Cedar St
- 543 E Cheyenne St
- 1034 E Park St Unit 1034
- 106 Cattail Ct Unit 106
- 504 E Acorn St
- 1070 E Park St Unit 1070
- 741 S Cypress St
- 0 E 175th St Unit HMS2609222
- 747 S Cherry St
- 133 N White Dr
- Lot 26 Sycamore St
- 319 N Alder St
- 238 S Elm St
- 17746 Red Bird St
- 17747 Red Bird St
- 0000 Clare Rd
- 329 S Center St
- 949 E Cottage Creek Dr
- 941 E Cottage Creek Dr
- 944 Oak Crest Dr
- 948 Oak Crest Dr
- 940 Oak Crest Dr
- 937 E Cottage Creek Dr
- 936 Oak Crest Dr
- 944 E Cottage Creek Dr
- 948 E Cottage Creek Dr
- 940 E Cottage Creek Dr
- 957 E Cottage Creek Dr
- 933 E Cottage Creek Dr
- 952 E Cottage Creek Dr
- 956 Oak Crest Dr
- 936 E Cottage Creek Dr
- 932 Oak Crest Dr
- 956 E Cottage Creek Dr
- 961 E Cottage Creek Dr
- 945 Oak Crest Dr
- 949 Oak Crest Dr
Your Personal Tour Guide
Ask me questions while you tour the home.