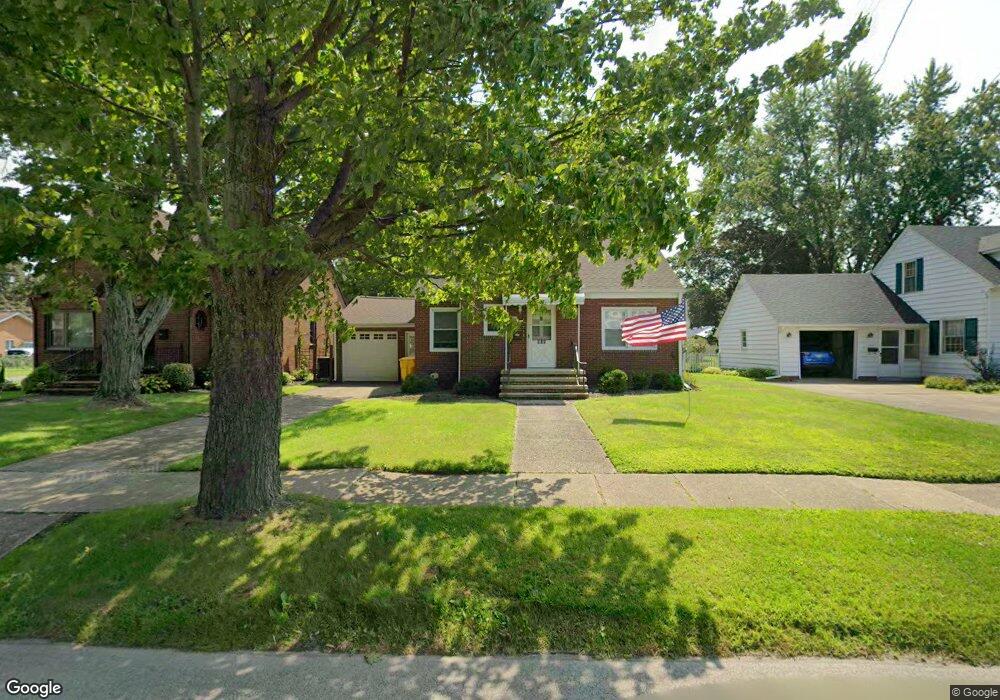
945 Main St Conneaut, OH 44030
Estimated Value: $161,334 - $214,000
3
Beds
1
Bath
1,523
Sq Ft
$120/Sq Ft
Est. Value
About This Home
This home is located at 945 Main St, Conneaut, OH 44030 and is currently estimated at $182,084, approximately $119 per square foot. 945 Main St is a home located in Ashtabula County with nearby schools including Lakeshore Primary Elementary School, Gateway Elementary School, and Conneaut Middle School.
Ownership History
Date
Name
Owned For
Owner Type
Purchase Details
Closed on
Nov 1, 2019
Sold by
Oliveira Candy
Bought by
Wright Linda J
Current Estimated Value
Purchase Details
Closed on
Nov 13, 2002
Sold by
Shoemaker Vista Louave
Bought by
Oliveira Candy
Home Financials for this Owner
Home Financials are based on the most recent Mortgage that was taken out on this home.
Original Mortgage
$58,000
Interest Rate
6.1%
Mortgage Type
New Conventional
Create a Home Valuation Report for This Property
The Home Valuation Report is an in-depth analysis detailing your home's value as well as a comparison with similar homes in the area
Home Values in the Area
Average Home Value in this Area
Purchase History
| Date | Buyer | Sale Price | Title Company |
|---|---|---|---|
| Wright Linda J | $109,000 | Chicago Title | |
| Oliveira Candy | $70,000 | -- |
Source: Public Records
Mortgage History
| Date | Status | Borrower | Loan Amount |
|---|---|---|---|
| Previous Owner | Oliveira Candy | $58,000 |
Source: Public Records
Tax History
| Year | Tax Paid | Tax Assessment Tax Assessment Total Assessment is a certain percentage of the fair market value that is determined by local assessors to be the total taxable value of land and additions on the property. | Land | Improvement |
|---|---|---|---|---|
| 2024 | $3,239 | $44,280 | $4,550 | $39,730 |
| 2023 | $1,632 | $44,280 | $4,550 | $39,730 |
| 2022 | $1,278 | $32,940 | $3,500 | $29,440 |
| 2021 | $1,301 | $32,940 | $3,500 | $29,440 |
| 2020 | $1,300 | $32,940 | $3,500 | $29,440 |
| 2019 | $1,441 | $26,360 | $1,860 | $24,500 |
| 2018 | $1,374 | $26,360 | $1,860 | $24,500 |
| 2017 | $1,350 | $26,360 | $1,860 | $24,500 |
| 2016 | $1,315 | $27,550 | $1,930 | $25,620 |
| 2015 | $1,328 | $27,550 | $1,930 | $25,620 |
| 2014 | $1,170 | $27,550 | $1,930 | $25,620 |
| 2013 | $1,207 | $29,230 | $2,870 | $26,360 |
Source: Public Records
Map
Nearby Homes
- 855 Spring St Unit S9
- 110 Edgewood Dr
- 247 Whitney St
- 238 Whitney St
- 745 Maple Ave
- 210 W Main Rd
- 18 Hillcrest Ct
- 202 W Main Rd Unit 132
- 202 W Main Rd Unit 115
- 536 Madison St
- 475 State St
- 474 Sherman St
- 220 Daniels Ave
- VL Center Rd
- 1145 Lake Rd
- 1150 Lake Rd
- 2663 Lake Rd
- 375 Bliss Ave
- 555 Wrights Ave
- 536 Mill St
Your Personal Tour Guide
Ask me questions while you tour the home.