Estimated Value: $410,000 - $465,746
3
Beds
2
Baths
1,708
Sq Ft
$263/Sq Ft
Est. Value
About This Home
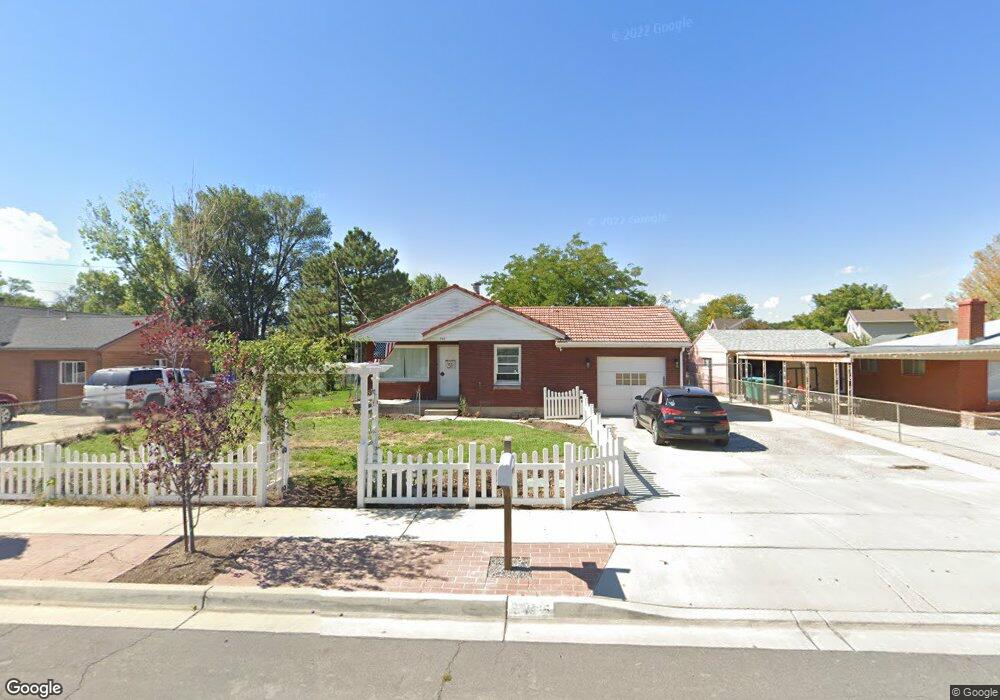
This home is located at 945 N 400 E, Lehi, UT 84043 and is currently estimated at $449,437, approximately $263 per square foot. 945 N 400 E is a home located in Utah County with nearby schools including Sego Lily Elementary School, Lehi Junior High School, and Skyridge High School.
Ownership History
Date
Name
Owned For
Owner Type
Purchase Details
Closed on
Jul 12, 2021
Sold by
Schmidt Diane
Bought by
Berg Landon Marcus and Berg Stefanie Marie
Current Estimated Value
Home Financials for this Owner
Home Financials are based on the most recent Mortgage that was taken out on this home.
Original Mortgage
$378,300
Outstanding Balance
$343,406
Interest Rate
2.93%
Mortgage Type
New Conventional
Estimated Equity
$106,031
Purchase Details
Closed on
Mar 31, 2019
Sold by
Hales Sheila
Bought by
Schmidt Diane
Purchase Details
Closed on
Mar 21, 2019
Sold by
Clayton Kathryn Noel and Bendowski Joshua
Bought by
Schmidt Diane
Purchase Details
Closed on
Feb 13, 2013
Sold by
Bendowski John J and Bendowski Sherrie
Bought by
Bendowski Sherrie and Schmidt Diane
Purchase Details
Closed on
Dec 26, 2006
Sold by
Bendowski Sherrie
Bought by
Bendowski John J and Bendowski Sherrie
Purchase Details
Closed on
Dec 22, 2006
Sold by
Hales Sheila
Bought by
Bendowski Sherrie
Create a Home Valuation Report for This Property
The Home Valuation Report is an in-depth analysis detailing your home's value as well as a comparison with similar homes in the area
Home Values in the Area
Average Home Value in this Area
Purchase History
| Date | Buyer | Sale Price | Title Company |
|---|---|---|---|
| Berg Landon Marcus | -- | Gt Title Services | |
| Schmidt Diane | -- | None Available | |
| Schmidt Diane | -- | None Available | |
| Bendowski Sherrie | -- | None Available | |
| Bendowski John J | -- | None Available | |
| Bendowski Sherrie | -- | None Available |
Source: Public Records
Mortgage History
| Date | Status | Borrower | Loan Amount |
|---|---|---|---|
| Open | Berg Landon Marcus | $378,300 |
Source: Public Records
Tax History Compared to Growth
Tax History
| Year | Tax Paid | Tax Assessment Tax Assessment Total Assessment is a certain percentage of the fair market value that is determined by local assessors to be the total taxable value of land and additions on the property. | Land | Improvement |
|---|---|---|---|---|
| 2025 | $1,758 | $225,115 | $198,400 | $210,900 |
| 2024 | $1,758 | $205,755 | $0 | $0 |
| 2023 | $1,635 | $207,790 | $0 | $0 |
| 2022 | $1,737 | $213,950 | $0 | $0 |
| 2021 | $1,515 | $282,100 | $114,800 | $167,300 |
| 2020 | $1,427 | $262,700 | $106,300 | $156,400 |
| 2019 | $1,266 | $242,300 | $106,300 | $136,000 |
| 2018 | $1,279 | $231,300 | $95,300 | $136,000 |
| 2017 | $1,215 | $116,820 | $0 | $0 |
| 2016 | $1,187 | $105,930 | $0 | $0 |
| 2015 | $1,120 | $94,875 | $0 | $0 |
| 2014 | $1,027 | $86,460 | $0 | $0 |
Source: Public Records
Map
Nearby Homes
- 705 N 400 E
- 1295 N 190 E
- 7 E State St
- 1329 N 100 E Unit 21
- 68 W State St
- 155 W State St Unit TRLR 3
- 832 N Somerset Alley
- 1150 N 200 W Unit 6
- 428 E 500 N
- 996 N 200 W
- 171 E 400 N
- 735 N 1000 E
- 443 W 820 N
- 4333 N Baiken Ridge Dr Unit 1020
- 1175 E 900 N
- 4561 N McKechnie Way Dr Unit 1119
- 281 N Center St
- 143 W 300 N
- 595 N 1200 E
- 174 E 100 N