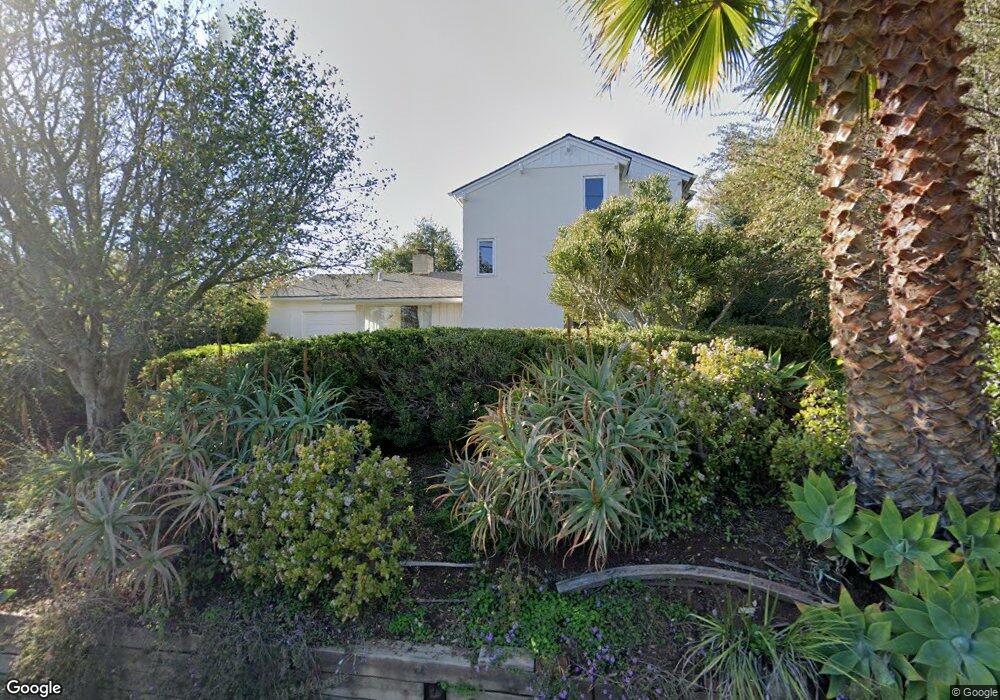
945 N Hope Ave Santa Barbara, CA 93110
Hope NeighborhoodEstimated Value: $1,082,518 - $2,142,000
1
Bed
1
Bath
768
Sq Ft
$1,982/Sq Ft
Est. Value
About This Home
This home is located at 945 N Hope Ave, Santa Barbara, CA 93110 and is currently estimated at $1,522,130, approximately $1,981 per square foot. 945 N Hope Ave is a home located in Santa Barbara County with nearby schools including Monte Vista Elementary School, La Colina Junior High School, and Santa Barbara Senior High School.
Ownership History
Date
Name
Owned For
Owner Type
Purchase Details
Closed on
Jun 17, 2021
Sold by
Boehm Kathleen M
Bought by
Boehm Kathleen M
Current Estimated Value
Home Financials for this Owner
Home Financials are based on the most recent Mortgage that was taken out on this home.
Original Mortgage
$307,500
Outstanding Balance
$233,473
Interest Rate
2.9%
Mortgage Type
New Conventional
Estimated Equity
$1,288,657
Purchase Details
Closed on
Aug 20, 2015
Sold by
Dawson Jared W
Bought by
Boehm Kathleen M
Home Financials for this Owner
Home Financials are based on the most recent Mortgage that was taken out on this home.
Original Mortgage
$375,000
Interest Rate
3.91%
Mortgage Type
New Conventional
Purchase Details
Closed on
Dec 10, 1998
Sold by
Dawson Jared W and Boehm Kathleen M
Bought by
Dawson Jared W and Boehm Kathleen M
Create a Home Valuation Report for This Property
The Home Valuation Report is an in-depth analysis detailing your home's value as well as a comparison with similar homes in the area
Home Values in the Area
Average Home Value in this Area
Purchase History
| Date | Buyer | Sale Price | Title Company |
|---|---|---|---|
| Boehm Kathleen M | -- | Wfg National Title | |
| Boehm Kathleen M | -- | Wfg National Title Ins Co | |
| Dawson Jared W | -- | Stewart Title |
Source: Public Records
Mortgage History
| Date | Status | Borrower | Loan Amount |
|---|---|---|---|
| Open | Boehm Kathleen M | $307,500 | |
| Closed | Boehm Kathleen M | $375,000 |
Source: Public Records
Tax History Compared to Growth
Tax History
| Year | Tax Paid | Tax Assessment Tax Assessment Total Assessment is a certain percentage of the fair market value that is determined by local assessors to be the total taxable value of land and additions on the property. | Land | Improvement |
|---|---|---|---|---|
| 2025 | $3,828 | $309,891 | $115,211 | $194,680 |
| 2023 | $3,828 | $297,859 | $110,738 | $187,121 |
| 2022 | $3,775 | $298,005 | $108,564 | $189,441 |
| 2021 | $3,451 | $272,555 | $106,436 | $166,119 |
| 2020 | $3,419 | $269,761 | $105,345 | $164,416 |
| 2019 | $3,335 | $264,473 | $103,280 | $161,193 |
| 2018 | $3,260 | $259,288 | $101,255 | $158,033 |
| 2017 | $3,120 | $254,205 | $99,270 | $154,935 |
| 2016 | $2,973 | $244,320 | $97,324 | $146,996 |
| 2015 | $2,945 | $240,651 | $95,863 | $144,788 |
| 2014 | $2,930 | $235,938 | $93,986 | $141,952 |
Source: Public Records
Map
Nearby Homes
- 3919 Antone Rd
- 3855 Calle Cita
- 3965 Foothill Rd
- 777 N Ontare Rd
- 3831 Sunset Rd
- 3756 Foothill (Private Lane) Rd
- 3676 Eileen Way
- 3706 Avon Ln
- 1230 Northridge Rd
- 3922 Via Diego Unit A
- 935 Cieneguitas Rd
- 3737 San Remo Dr
- 3663 San Remo Dr Unit 4F
- 334 Canon Dr
- 3728 State St Unit 135
- 3726 State St Unit 203
- 3728 State St Unit 136
- 3726 State St Unit 204
- 3914 Via Lucero Unit F
- 3791 State St Unit A
- 925 N Hope Ave
- 3800 Center Ave
- 3810 Crescent Dr
- 989 N Hope Ave
- 944 N Hope Ave
- 3803 Crescent Dr
- 912 N Hope Ave
- 976 N Hope Ave
- 3815 Crescent Dr
- 3815 Sterrett Ave
- 0 Hope Ranch Area Unit RN-2336
- 3805 Center Ave
- 3818 Crescent Dr
- 3826 Center Ave
- 3786 Center Ave
- 985 Crestwood Dr
- 883 N Hope Ave
- 3811 Center Ave
- 3819 Sterrett Ave
- 3821 Crescent Dr