945 S Clovis Ave Unit B Fresno, CA 93727
Sunnyside NeighborhoodEstimated Value: $248,113 - $275,000
2
Beds
2
Baths
1,548
Sq Ft
$170/Sq Ft
Est. Value
About This Home
This home is located at 945 S Clovis Ave Unit B, Fresno, CA 93727 and is currently estimated at $263,778, approximately $170 per square foot. 945 S Clovis Ave Unit B is a home located in Fresno County with nearby schools including Ayer Elementary School, Elizabeth Terronez Middle School, and Sunnyside High School.
Ownership History
Date
Name
Owned For
Owner Type
Purchase Details
Closed on
Jun 7, 2021
Sold by
Wade George J and Wade George J
Bought by
Montano Fernando and Montano Georgiann Audra
Current Estimated Value
Home Financials for this Owner
Home Financials are based on the most recent Mortgage that was taken out on this home.
Original Mortgage
$6,000
Outstanding Balance
$5,454
Interest Rate
3.02%
Mortgage Type
New Conventional
Estimated Equity
$258,324
Purchase Details
Closed on
Mar 26, 2014
Sold by
Wade George J and Wade Barbara J
Bought by
George J Wade Jr & Barbara J Wade Living
Purchase Details
Closed on
Oct 28, 2002
Sold by
Ashworth Elaine Covert and Ashworth Robert L
Bought by
Wade George J and Wade Barbara J
Purchase Details
Closed on
Feb 25, 1997
Sold by
Ashworth Robert
Bought by
Covert Elaine
Purchase Details
Closed on
Feb 24, 1997
Sold by
Kious Peggy Gene and Kious Bradley E
Bought by
Covert Elaine
Create a Home Valuation Report for This Property
The Home Valuation Report is an in-depth analysis detailing your home's value as well as a comparison with similar homes in the area
Home Values in the Area
Average Home Value in this Area
Purchase History
| Date | Buyer | Sale Price | Title Company |
|---|---|---|---|
| Montano Fernando | $200,000 | Old Republic Title Company | |
| George J Wade Jr & Barbara J Wade Living | -- | None Available | |
| Wade George J | $99,000 | Chicago Title Company | |
| Covert Elaine | -- | Central Title Company | |
| Covert Elaine | $97,500 | Central Title Company |
Source: Public Records
Mortgage History
| Date | Status | Borrower | Loan Amount |
|---|---|---|---|
| Open | Montano Fernando | $6,000 | |
| Open | Montano Fernando | $194,000 |
Source: Public Records
Tax History
| Year | Tax Paid | Tax Assessment Tax Assessment Total Assessment is a certain percentage of the fair market value that is determined by local assessors to be the total taxable value of land and additions on the property. | Land | Improvement |
|---|---|---|---|---|
| 2025 | $2,651 | $215,942 | $53,578 | $162,364 |
| 2023 | $2,497 | $207,559 | $51,499 | $156,060 |
| 2022 | $2,462 | $203,490 | $50,490 | $153,000 |
| 2021 | $1,636 | $131,109 | $33,442 | $97,667 |
| 2020 | $1,629 | $129,766 | $33,100 | $96,666 |
| 2019 | $1,566 | $127,222 | $32,451 | $94,771 |
| 2018 | $1,532 | $124,728 | $31,815 | $92,913 |
| 2017 | $1,506 | $122,284 | $31,192 | $91,092 |
| 2016 | $1,456 | $119,887 | $30,581 | $89,306 |
| 2015 | $1,434 | $118,087 | $30,122 | $87,965 |
| 2014 | $1,408 | $115,774 | $29,532 | $86,242 |
Source: Public Records
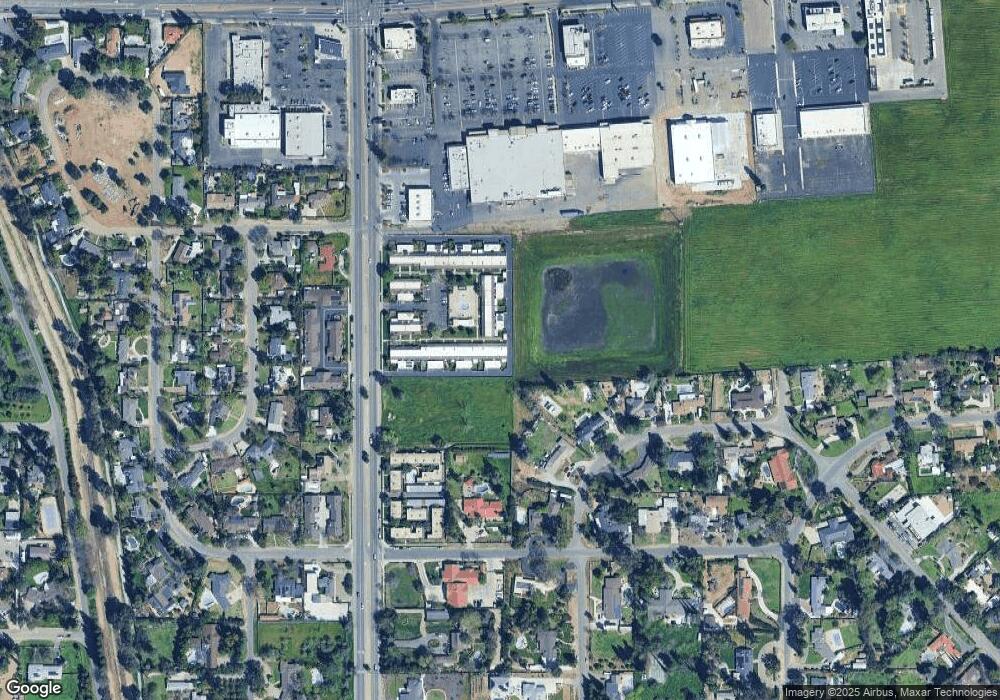
Map
Nearby Homes
- 945 S Clovis Ave Unit H
- 945 S Clovis Ave Unit V
- 935 S Park Circle Dr
- 930 S Park Circle Dr
- 1112 S Sunnyside Ave
- 5526 E Inyo St
- 5812 E Midwick Ln
- 540 S Argyle Ave Unit 101
- 5478 E Butler Ave
- 1771 S Waverly Ln
- 5431 E Liberty Ave
- 5454 E Butler Ave
- 372 S Argyle Ave Unit 102
- 350 S Argyle Ave Unit 103
- 350 S Argyle Ave Unit 101
- 925 S Purdue Ave
- 5869 E Mono St
- 833 S Stanford Ave
- 5865 E Beck Ave
- 5867 E Club View Dr
- 945 S Clovis Ave Unit K
- 945 S Clovis Ave Unit G
- 945 S Clovis Ave Unit Z
- 945 S Clovis Ave Unit Q
- 945 S Clovis Ave Unit D
- 945 S Clovis Ave Unit S
- 945 S Clovis Ave Unit A
- 945 S Clovis Ave Unit E
- 945 S Clovis Ave Unit X
- 945 S Clovis Ave Unit F
- 945 S Clovis Ave Unit Y
- 945 S Clovis Ave Unit J
- 945 S Clovis Ave Unit R
- 945 S Clovis Ave Unit L
- 945 S Clovis Ave Unit P
- 945 S Clovis Ave Unit N
- 945 S Clovis Ave Unit C
- 945 S Clovis Ave Unit U
- 945 S Clovis Ave Unit W
- 945 S Clovis Ave Unit T