Estimated Value: $217,000 - $563,000
4
Beds
2
Baths
1,324
Sq Ft
$346/Sq Ft
Est. Value
About This Home
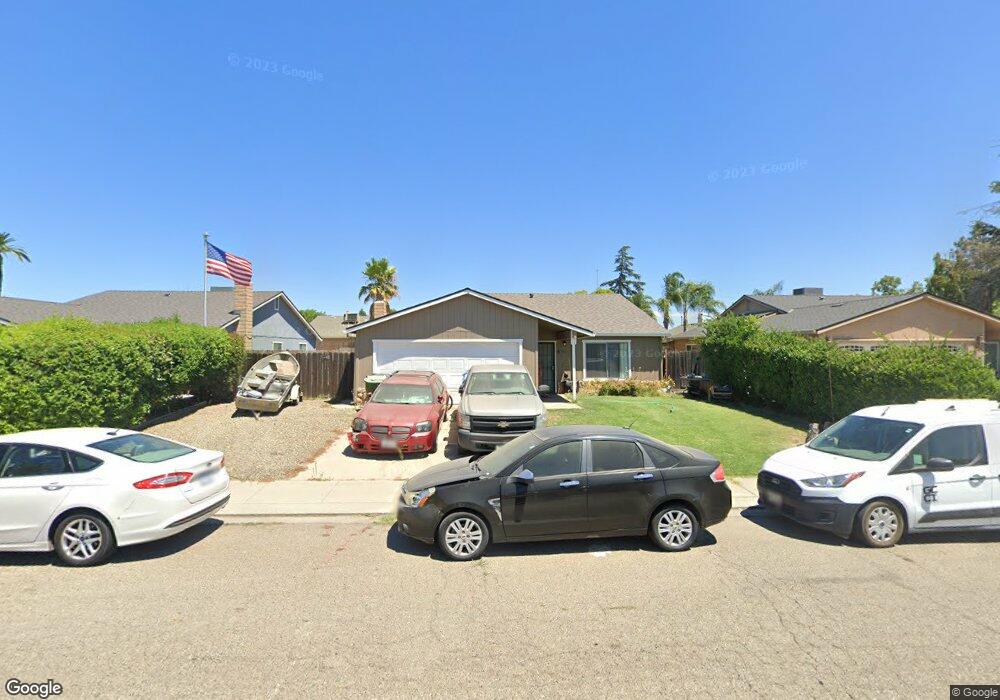
This home is located at 946 Busman Dr, Ripon, CA 95366 and is currently estimated at $457,623, approximately $345 per square foot. 946 Busman Dr is a home located in San Joaquin County with nearby schools including Weston Elementary School, Ripon Elementary School, and Park View Elementary School.
Ownership History
Date
Name
Owned For
Owner Type
Purchase Details
Closed on
May 1, 2024
Sold by
Silva Eddie M and Silva Gabriela
Bought by
Eddie And Gabriela Silva Living Trust and Silva
Current Estimated Value
Purchase Details
Closed on
Dec 14, 1997
Sold by
Eddie Silva
Bought by
Rocha Anthony J C and Rocha Phyllis M
Home Financials for this Owner
Home Financials are based on the most recent Mortgage that was taken out on this home.
Original Mortgage
$73,000
Interest Rate
7.23%
Create a Home Valuation Report for This Property
The Home Valuation Report is an in-depth analysis detailing your home's value as well as a comparison with similar homes in the area
Home Values in the Area
Average Home Value in this Area
Purchase History
| Date | Buyer | Sale Price | Title Company |
|---|---|---|---|
| Eddie And Gabriela Silva Living Trust | -- | None Listed On Document | |
| Rocha Anthony J C | -- | First American Title Co |
Source: Public Records
Mortgage History
| Date | Status | Borrower | Loan Amount |
|---|---|---|---|
| Previous Owner | Rocha Anthony J C | $73,000 |
Source: Public Records
Tax History
| Year | Tax Paid | Tax Assessment Tax Assessment Total Assessment is a certain percentage of the fair market value that is determined by local assessors to be the total taxable value of land and additions on the property. | Land | Improvement |
|---|---|---|---|---|
| 2025 | $1,971 | $175,628 | $79,831 | $95,797 |
| 2024 | $1,939 | $172,185 | $78,266 | $93,919 |
| 2023 | $1,901 | $168,810 | $76,732 | $92,078 |
| 2022 | $1,871 | $165,501 | $75,228 | $90,273 |
| 2021 | $1,843 | $162,256 | $73,753 | $88,503 |
| 2020 | $1,827 | $160,593 | $72,997 | $87,596 |
| 2019 | $1,797 | $157,445 | $71,566 | $85,879 |
| 2018 | $1,770 | $154,359 | $70,163 | $84,196 |
| 2017 | $1,736 | $151,334 | $68,788 | $82,546 |
| 2016 | $1,708 | $148,367 | $67,440 | $80,927 |
| 2014 | $1,646 | $143,277 | $65,126 | $78,151 |
Source: Public Records
Map
Nearby Homes
- 1434 Augusta Pointe Dr
- 23811 S Jack Tone Rd
- 1672 Bailey Dr
- 1621 Davis St
- 1671 Davis St
- 818 Travaille Way
- 138 Roxie Ct
- 336 Kristen Way
- 1191 S Mohler Rd
- 205 3rd St
- 136 N Acacia Ave
- 150 N Acacia Ave
- 410 Pine St
- 663 Clay Way
- 244 California St
- 622 N Stockton Ave
- 960 Goodwin Dr
- 565 Bodeson Ct
- 446 Meyenberg Ave
- 788 E Milgeo Ave
Your Personal Tour Guide
Ask me questions while you tour the home.