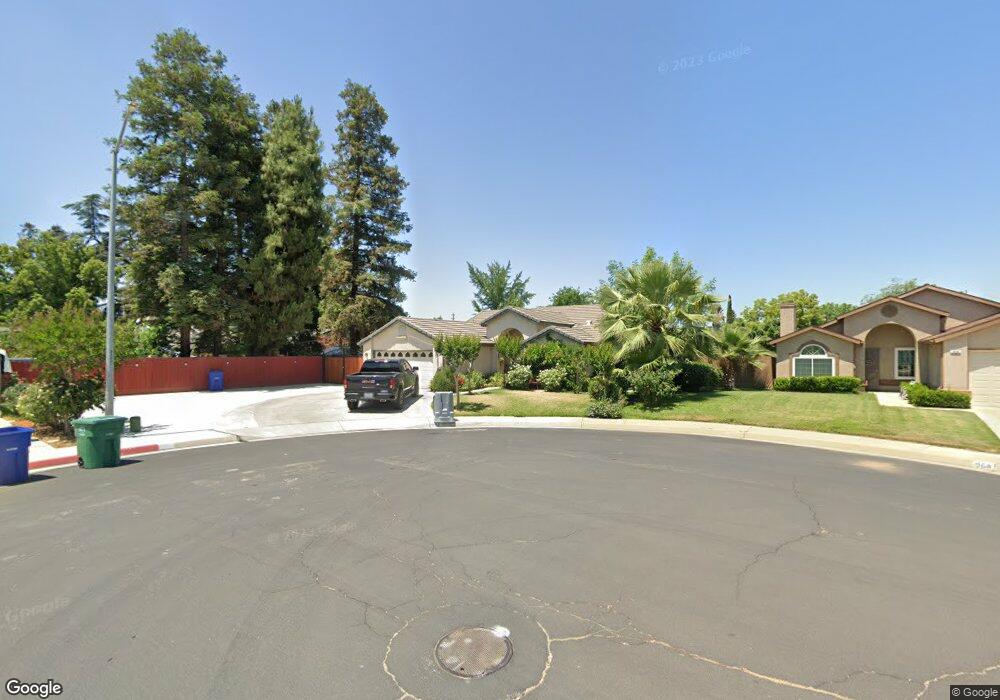
946 E Carob Ave Reedley, CA 93654
Estimated Value: $375,983 - $454,000
4
Beds
2
Baths
1,550
Sq Ft
$266/Sq Ft
Est. Value
About This Home
This home is located at 946 E Carob Ave, Reedley, CA 93654 and is currently estimated at $412,328, approximately $266 per square foot. 946 E Carob Ave is a home located in Fresno County with nearby schools including Thomas Law Reed Elementary School, Reedley High School, and Reedley Middle College High.
Ownership History
Date
Name
Owned For
Owner Type
Purchase Details
Closed on
Jun 1, 2001
Sold by
Hud
Bought by
Camargo Jose C and Camargo Maria Elena
Current Estimated Value
Home Financials for this Owner
Home Financials are based on the most recent Mortgage that was taken out on this home.
Original Mortgage
$103,500
Outstanding Balance
$39,454
Interest Rate
7.15%
Estimated Equity
$372,874
Purchase Details
Closed on
Mar 30, 2001
Sold by
Wells Fargo Home Mtg Inc
Bought by
Hud
Purchase Details
Closed on
Oct 19, 2000
Sold by
Martin Rubalcava and Gabriel Rubalcava
Bought by
Wells Fargo Home Mtg Inc
Purchase Details
Closed on
Jun 10, 1998
Sold by
Columbia Park Estates Llc
Bought by
Rubalcava Martin and Rubalcava Cabriel
Home Financials for this Owner
Home Financials are based on the most recent Mortgage that was taken out on this home.
Original Mortgage
$111,572
Interest Rate
6.88%
Mortgage Type
FHA
Create a Home Valuation Report for This Property
The Home Valuation Report is an in-depth analysis detailing your home's value as well as a comparison with similar homes in the area
Home Values in the Area
Average Home Value in this Area
Purchase History
| Date | Buyer | Sale Price | Title Company |
|---|---|---|---|
| Camargo Jose C | $115,000 | North American Title Co | |
| Hud | -- | First American Title Ins Co | |
| Wells Fargo Home Mtg Inc | $117,388 | First American Title Ins Co | |
| Rubalcava Martin | $113,000 | Chicago Title Co |
Source: Public Records
Mortgage History
| Date | Status | Borrower | Loan Amount |
|---|---|---|---|
| Open | Camargo Jose C | $103,500 | |
| Previous Owner | Rubalcava Martin | $111,572 |
Source: Public Records
Tax History
| Year | Tax Paid | Tax Assessment Tax Assessment Total Assessment is a certain percentage of the fair market value that is determined by local assessors to be the total taxable value of land and additions on the property. | Land | Improvement |
|---|---|---|---|---|
| 2025 | $2,003 | $172,507 | $45,191 | $127,316 |
| 2023 | $1,961 | $165,810 | $43,437 | $122,373 |
| 2022 | $1,965 | $162,560 | $42,586 | $119,974 |
| 2021 | $1,922 | $159,373 | $41,751 | $117,622 |
| 2020 | $1,940 | $157,739 | $41,323 | $116,416 |
| 2019 | $1,887 | $154,647 | $40,513 | $114,134 |
| 2018 | $1,884 | $151,616 | $39,719 | $111,897 |
| 2017 | $1,795 | $148,644 | $38,941 | $109,703 |
| 2016 | $1,826 | $145,730 | $38,178 | $107,552 |
| 2015 | $1,763 | $143,542 | $37,605 | $105,937 |
| 2014 | $1,761 | $140,731 | $36,869 | $103,862 |
Source: Public Records
Map
Nearby Homes
- 19317 E Parlier Ave
- 19326 E Parlier Ave
- 1405 E Cypress Ave Unit 157
- 1405 E Cypress Ave Unit 137
- 1175 N Frankwood Ave
- 266 E Linden Ave
- 165 E Linden Ave
- 19342 E South Ave
- 19282 E South Ave
- 1372 E Laroda Cir
- 155 N Haney Ave
- 657 W Parlier Ave Unit 107
- 657 W Parlier Ave Unit 106
- 657 W Parlier Ave Unit 114
- 657 W Parlier Ave Unit 130
- 657 W Parlier Ave Unit 125
- 216 S Sunset Ave
- 1249 D St
- 864 E Evening Glow Ave
- 223 S Kady Ave
- 968 E Carob Ave
- 1518 N Columbia Ave
- 984 E Carob Ave
- 1546 N Columbia Ave
- 945 E Carob Ave
- 969 E Carob Ave
- 1460 N Columbia Ave
- 1590 N Columbia Ave
- 1026 E Carob Ave
- 985 E Carob Ave
- 1048 E Carob Ave
- 1489 N Fisher Ave
- 1636 N Columbia Ave
- 1451 N Magnolia Ave
- 1454 N Magnolia Ave
- 8565 S Columbia Ave
- 1477 N Columbia Ave
- 1450 N Columbia Ave
- 1467 N Fisher Ave
- 1446 N Magnolia Ave
Your Personal Tour Guide
Ask me questions while you tour the home.