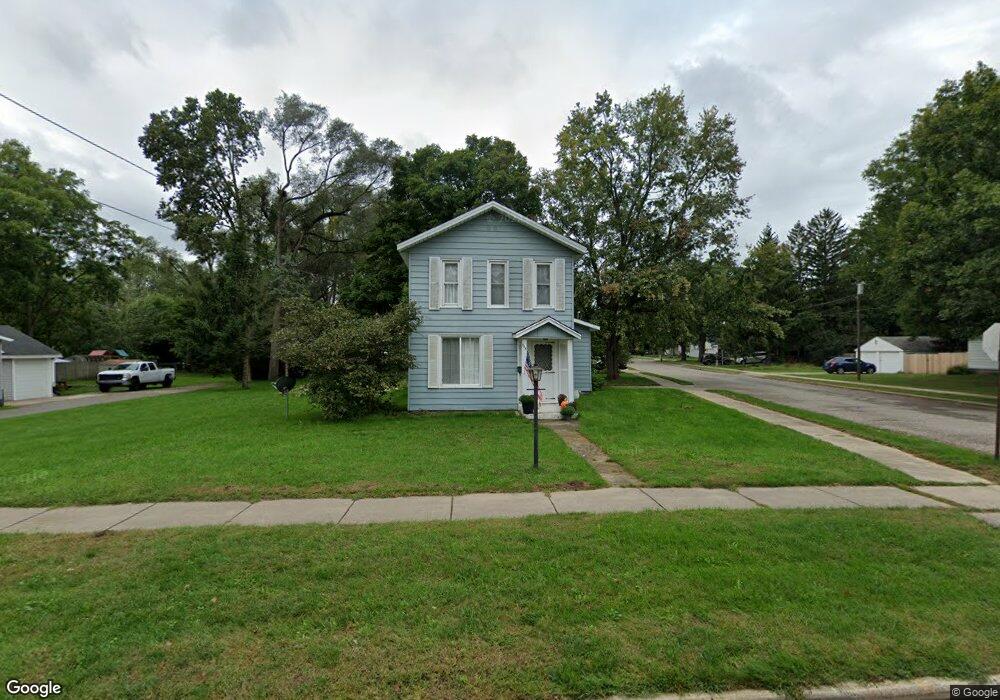
946 Lincoln Lake Lowell, MI 49331
Estimated Value: $258,000 - $375,000
3
Beds
2
Baths
1,488
Sq Ft
$198/Sq Ft
Est. Value
About This Home
This home is located at 946 Lincoln Lake, Lowell, MI 49331 and is currently estimated at $294,476, approximately $197 per square foot. 946 Lincoln Lake is a home located in Kent County with nearby schools including Bushnell Elementary School, Cherry Creek Elementary School, and Lowell Middle School.
Ownership History
Date
Name
Owned For
Owner Type
Purchase Details
Closed on
Jan 6, 2021
Sold by
Misner Tessa
Bought by
Misner Tessa and Misner Stephen K
Current Estimated Value
Purchase Details
Closed on
Oct 23, 2014
Sold by
Weidman Matthew B and Weidman Sallee B
Bought by
Misner Tessa
Home Financials for this Owner
Home Financials are based on the most recent Mortgage that was taken out on this home.
Original Mortgage
$96,938
Outstanding Balance
$74,617
Interest Rate
4.21%
Mortgage Type
New Conventional
Estimated Equity
$219,859
Purchase Details
Closed on
May 18, 2007
Sold by
Roy Raymond F and Roy Diane K
Bought by
Weidman Matthew B and Weidman Sallee B
Home Financials for this Owner
Home Financials are based on the most recent Mortgage that was taken out on this home.
Original Mortgage
$98,455
Interest Rate
6.26%
Mortgage Type
FHA
Purchase Details
Closed on
Nov 1, 1986
Bought by
Roy R and Weidman Matthew B
Create a Home Valuation Report for This Property
The Home Valuation Report is an in-depth analysis detailing your home's value as well as a comparison with similar homes in the area
Home Values in the Area
Average Home Value in this Area
Purchase History
| Date | Buyer | Sale Price | Title Company |
|---|---|---|---|
| Misner Tessa | -- | None Available | |
| Misner Tessa | $100,000 | Chicago Title | |
| Weidman Matthew B | $100,000 | Chicago Title | |
| Roy R | $48,000 | -- |
Source: Public Records
Mortgage History
| Date | Status | Borrower | Loan Amount |
|---|---|---|---|
| Open | Misner Tessa | $96,938 | |
| Previous Owner | Weidman Matthew B | $98,455 |
Source: Public Records
Tax History Compared to Growth
Tax History
| Year | Tax Paid | Tax Assessment Tax Assessment Total Assessment is a certain percentage of the fair market value that is determined by local assessors to be the total taxable value of land and additions on the property. | Land | Improvement |
|---|---|---|---|---|
| 2025 | $2,568 | $110,100 | $0 | $0 |
| 2024 | $2,568 | $107,200 | $0 | $0 |
| 2023 | $2,903 | $97,900 | $0 | $0 |
| 2022 | $2,784 | $89,400 | $0 | $0 |
| 2021 | $2,706 | $81,000 | $0 | $0 |
| 2020 | $2,243 | $74,600 | $0 | $0 |
| 2019 | $2,634 | $73,400 | $0 | $0 |
| 2018 | $2,578 | $69,900 | $0 | $0 |
| 2017 | $2,513 | $61,300 | $0 | $0 |
| 2016 | $2,443 | $55,000 | $0 | $0 |
| 2015 | -- | $55,000 | $0 | $0 |
| 2013 | -- | $53,600 | $0 | $0 |
Source: Public Records
Map
Nearby Homes
- 610 Birchwood Ct SE
- 510 N Hudson St SE
- 725 N Lafayette St SE
- 521 Spring St
- 913 N Monroe St
- 926 N Washington St
- 220 King St Unit 10
- 220 King St Unit 6
- 1060 N Washington St
- 414 N Jefferson St
- 216 W Main St Unit 6
- 1550 Carol Lynne Dr
- 1080 N Washington St SE
- Cedarwood Plan at Flat River Estates
- Sycamore Plan at Flat River Estates
- Elmwood Plan at Flat River Estates
- Chestnut Plan at Flat River Estates
- Redwood Plan at Flat River Estates
- Whitby Plan at Flat River Estates
- Bay Harbor Plan at Flat River Estates
- 946 Lincoln Lake
- 938 Lincoln Lake
- 938 Lincoln Lake
- 932 Lincoln Lake
- 932 Lincoln Lake Ave
- 932 Lincoln Lake
- 1000 Lincoln Lake
- 1000 Lincoln Lake
- 526 Hunt St
- 526 Hunt St SE
- 931 Beech St
- 943 Beech St
- 1000 Lincoln Lake
- 930 Lincoln Lake
- 983 Lincoln Lake
- 930 Lincoln Lake
- 930 Lincoln Lake
- 925 Beech St
- 945 Lincoln Lake
- 525 Hunt St