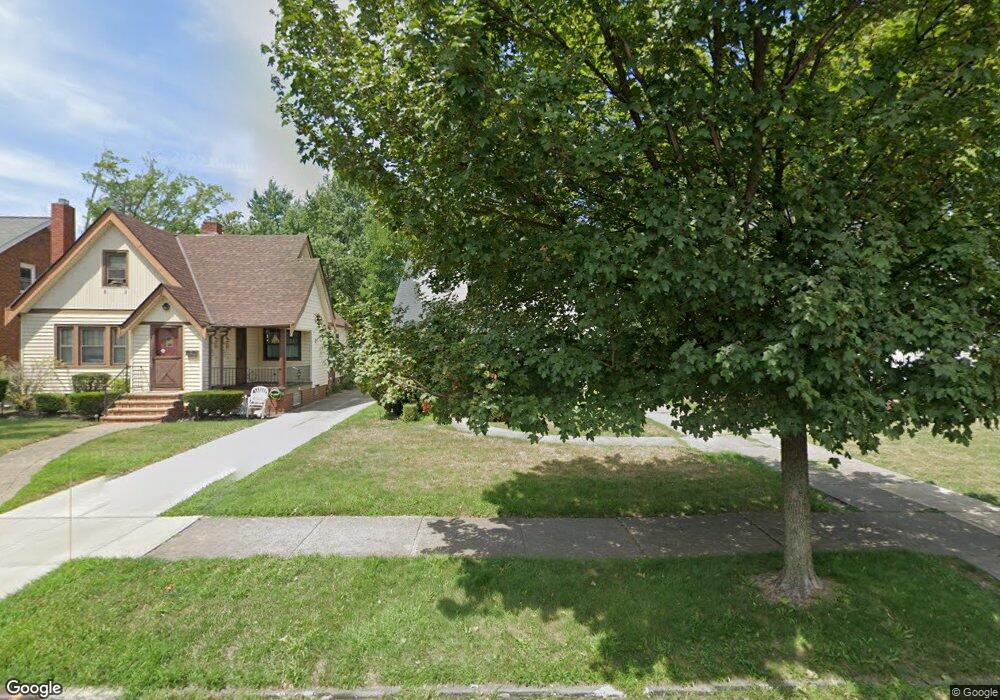
946 Pembrook Rd Cleveland, OH 44121
Monticello-Noble NeighborhoodEstimated Value: $131,000 - $196,000
2
Beds
1
Bath
1,418
Sq Ft
$113/Sq Ft
Est. Value
About This Home
This home is located at 946 Pembrook Rd, Cleveland, OH 44121 and is currently estimated at $159,551, approximately $112 per square foot. 946 Pembrook Rd is a home located in Cuyahoga County with nearby schools including Oxford Elementary School, Monticello Middle School, and Cleveland Heights High School.
Ownership History
Date
Name
Owned For
Owner Type
Purchase Details
Closed on
Nov 27, 2006
Sold by
Iwanaga Lilian
Bought by
Smith Brenda and Smith Ronetta
Current Estimated Value
Home Financials for this Owner
Home Financials are based on the most recent Mortgage that was taken out on this home.
Original Mortgage
$123,000
Outstanding Balance
$83,657
Interest Rate
8.95%
Mortgage Type
Purchase Money Mortgage
Estimated Equity
$75,894
Purchase Details
Closed on
Jan 29, 2004
Sold by
Hud
Bought by
Iwanaga Lilian
Purchase Details
Closed on
Jan 23, 2003
Sold by
Brooks Lucille D
Bought by
Hud
Purchase Details
Closed on
Apr 19, 1991
Sold by
Gilmore Elinor A
Bought by
Brooks Lucille D
Purchase Details
Closed on
Apr 29, 1988
Sold by
Gilmore Elinore A and Gilmore John P
Bought by
Gilmore Elinor A
Purchase Details
Closed on
Oct 13, 1983
Sold by
Gilmore Elinor A
Bought by
Gilmore Elinore A and Gilmore John P
Purchase Details
Closed on
Jan 1, 1975
Bought by
Gilmore Elinor A
Create a Home Valuation Report for This Property
The Home Valuation Report is an in-depth analysis detailing your home's value as well as a comparison with similar homes in the area
Home Values in the Area
Average Home Value in this Area
Purchase History
| Date | Buyer | Sale Price | Title Company |
|---|---|---|---|
| Smith Brenda | $118,000 | Amer Choice | |
| Iwanaga Lilian | $61,000 | Lakeside Title & Escrow Agen | |
| Hud | $54,667 | U S Title Agency Inc | |
| Brooks Lucille D | $61,900 | -- | |
| Gilmore Elinor A | -- | -- | |
| Gilmore Elinore A | -- | -- | |
| Gilmore Elinor A | -- | -- |
Source: Public Records
Mortgage History
| Date | Status | Borrower | Loan Amount |
|---|---|---|---|
| Open | Smith Brenda | $123,000 |
Source: Public Records
Tax History Compared to Growth
Tax History
| Year | Tax Paid | Tax Assessment Tax Assessment Total Assessment is a certain percentage of the fair market value that is determined by local assessors to be the total taxable value of land and additions on the property. | Land | Improvement |
|---|---|---|---|---|
| 2024 | $3,615 | $42,350 | $8,925 | $33,425 |
| 2023 | $3,055 | $27,860 | $5,040 | $22,820 |
| 2022 | $3,040 | $27,860 | $5,040 | $22,820 |
| 2021 | $2,979 | $27,860 | $5,040 | $22,820 |
| 2020 | $2,968 | $25,100 | $4,550 | $20,550 |
| 2019 | $2,805 | $71,700 | $13,000 | $58,700 |
| 2018 | $2,807 | $25,100 | $4,550 | $20,550 |
| 2017 | $2,718 | $22,580 | $4,660 | $17,920 |
| 2016 | $3,470 | $21,390 | $4,660 | $16,730 |
| 2015 | $2,923 | $21,390 | $4,660 | $16,730 |
| 2014 | $2,923 | $25,760 | $5,600 | $20,160 |
Source: Public Records
Map
Nearby Homes
- 967 Pembrook Rd
- 990 Pembrook Rd
- 901 Woodview Rd
- 888 Medford Rd
- 971 Rushleigh Rd
- 891 Medford Rd
- 1005 Woodview Rd
- 915 Clarence Rd
- 986 Woodview Rd
- 999 Rushleigh Rd
- 3451 Hartwood Rd
- 1033 Rushleigh Rd
- 931 Yellowstone Rd
- 1058 Pembrook Rd
- 916 Whitby Rd
- 1064 Elbon Rd
- 2400 Noble Rd
- 1068 Elbon Rd
- 3411 Hartwood Rd
- 2440 Noble Rd Unit 208