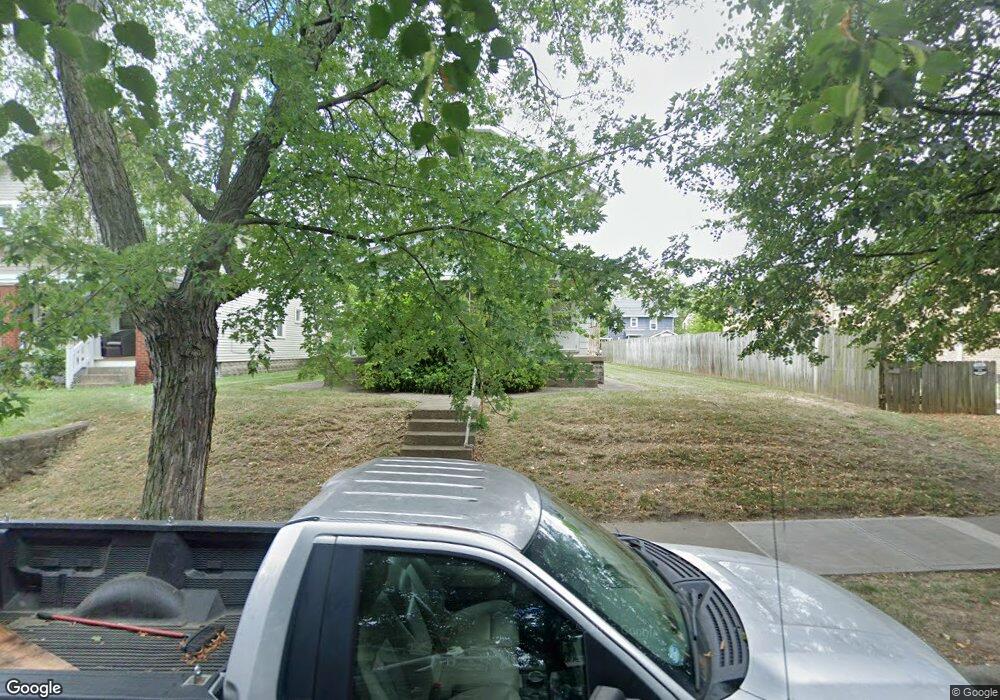
946 Thomas Rd Unit 948 Columbus, OH 43212
Estimated Value: $355,000 - $646,000
6
Beds
2
Baths
2,184
Sq Ft
$217/Sq Ft
Est. Value
About This Home
This home is located at 946 Thomas Rd Unit 948, Columbus, OH 43212 and is currently estimated at $473,930, approximately $217 per square foot. 946 Thomas Rd Unit 948 is a home located in Franklin County with nearby schools including Robert Louis Stevenson Elementary School, Larson Middle School, and Grandview Heights High School.
Ownership History
Date
Name
Owned For
Owner Type
Purchase Details
Closed on
Mar 14, 2005
Sold by
Jones Carl C and Jones Patti L
Bought by
Calvert Charles E and Calvert Aimee C
Current Estimated Value
Purchase Details
Closed on
Aug 1, 2002
Sold by
Rosenthal Wesley B and Miller Doug A
Bought by
Jones Carl C and Jones Patti L
Purchase Details
Closed on
Jul 31, 2000
Sold by
Dematteis Christine E
Bought by
Rosenthal Wesley B and Miller Doug A
Home Financials for this Owner
Home Financials are based on the most recent Mortgage that was taken out on this home.
Original Mortgage
$120,000
Interest Rate
8.19%
Purchase Details
Closed on
Dec 31, 1986
Bought by
Dematteis Christine E
Create a Home Valuation Report for This Property
The Home Valuation Report is an in-depth analysis detailing your home's value as well as a comparison with similar homes in the area
Home Values in the Area
Average Home Value in this Area
Purchase History
| Date | Buyer | Sale Price | Title Company |
|---|---|---|---|
| Calvert Charles E | $150,000 | -- | |
| Jones Carl C | $161,500 | Chicago Title | |
| Rosenthal Wesley B | $150,000 | Chicago Title | |
| Dematteis Christine E | -- | -- |
Source: Public Records
Mortgage History
| Date | Status | Borrower | Loan Amount |
|---|---|---|---|
| Previous Owner | Rosenthal Wesley B | $120,000 |
Source: Public Records
Tax History
| Year | Tax Paid | Tax Assessment Tax Assessment Total Assessment is a certain percentage of the fair market value that is determined by local assessors to be the total taxable value of land and additions on the property. | Land | Improvement |
|---|---|---|---|---|
| 2025 | $5,589 | $94,080 | $61,460 | $32,620 |
| 2024 | $5,589 | $94,080 | $61,460 | $32,620 |
| 2023 | $4,908 | $94,080 | $61,460 | $32,620 |
| 2022 | $7,197 | $117,470 | $40,500 | $76,970 |
| 2021 | $6,747 | $117,470 | $40,500 | $76,970 |
| 2020 | $6,720 | $117,470 | $40,500 | $76,970 |
| 2019 | $6,445 | $99,690 | $40,500 | $59,190 |
| 2018 | $5,681 | $99,690 | $40,500 | $59,190 |
| 2017 | $6,025 | $99,690 | $40,500 | $59,190 |
| 2016 | $4,939 | $69,900 | $26,920 | $42,980 |
| 2015 | $4,939 | $69,900 | $26,920 | $42,980 |
| 2014 | $4,954 | $69,900 | $26,920 | $42,980 |
| 2013 | $2,181 | $63,525 | $24,465 | $39,060 |
Source: Public Records
Map
Nearby Homes
- 1141 Mulford Rd
- 922 Northwest Blvd
- 912 Northwest Blvd Unit 910
- 1081 W 3rd Ave
- 797 Gladden Rd
- 796 Gladden Rd
- 951 Hudson Crossing
- 967-973 Burr Ave
- 924 Pullman Place Unit 32
- 827 Northwest Blvd Unit 827-833
- 867 Pullman Way
- 952 Pullman Place Unit 27
- 942 W 1st Ave
- 862 Pullman Way
- 789 Northwest Blvd Unit G
- 1126 Northwest Blvd
- 1116 Edgehill Rd
- 945 Quay Ave Unit 945G
- 945 Quay Ave Unit 945E
- 1162 Edgehill Rd
- 950 Thomas Rd Unit 950
- 954 Thomas Rd Unit 954
- 936 Thomas Rd
- 932 Thomas Rd Unit 934
- 939 Copeland Rd
- 1081 Mulford Rd Unit 85
- 933 Copeland Rd
- 1075 Mulford Rd Unit 77
- 943 Copeland Rd
- 1089 Mulford Rd
- 947 Thomas Rd
- 929 Copeland Rd
- 1071 Mulford Rd Unit 73
- 928 Thomas Rd Unit 930
- 928 Thomas Rd
- 925 Copeland Rd
- 945 Thomas Rd
- 955 Thomas Rd
- 1065 Mulford Rd Unit 67
- 939 Thomas Rd Unit 941
Your Personal Tour Guide
Ask me questions while you tour the home.