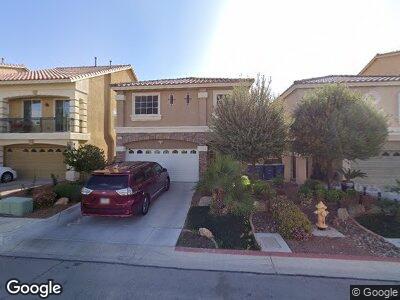
9462 Niagara Landing St Las Vegas, NV 89139
Highlands Ranch NeighborhoodEstimated Value: $514,719 - $574,000
5
Beds
3
Baths
2,290
Sq Ft
$239/Sq Ft
Est. Value
About This Home
This home is located at 9462 Niagara Landing St, Las Vegas, NV 89139 and is currently estimated at $546,930, approximately $238 per square foot. 9462 Niagara Landing St is a home with nearby schools including Aldeane Comito Ries Elementary School, Lois & Jerry Tarkanian Middle School, and Desert Oasis High School.
Ownership History
Date
Name
Owned For
Owner Type
Purchase Details
Closed on
May 30, 2017
Sold by
Acoba Sergio and Acoba Dorifel T
Bought by
Alejandro Valentine I and Alejandro Diosa M
Current Estimated Value
Home Financials for this Owner
Home Financials are based on the most recent Mortgage that was taken out on this home.
Original Mortgage
$244,200
Interest Rate
4.12%
Mortgage Type
FHA
Purchase Details
Closed on
Dec 4, 2014
Sold by
Bridgewater 3 Llc
Bought by
Acoba Dorifel T and Acoba Sergio
Home Financials for this Owner
Home Financials are based on the most recent Mortgage that was taken out on this home.
Original Mortgage
$210,482
Interest Rate
3.95%
Mortgage Type
New Conventional
Purchase Details
Closed on
Jul 15, 2014
Sold by
Long Term Land Holdings Inc
Bought by
Bridgewater 3 Llc
Purchase Details
Closed on
Jun 23, 2014
Sold by
Cft Lands Llc
Bought by
Long Term Land Holdings Inc
Create a Home Valuation Report for This Property
The Home Valuation Report is an in-depth analysis detailing your home's value as well as a comparison with similar homes in the area
Home Values in the Area
Average Home Value in this Area
Purchase History
| Date | Buyer | Sale Price | Title Company |
|---|---|---|---|
| Alejandro Valentine I | $290,000 | Wfg National Title Co | |
| Acoba Dorifel T | $290,482 | First American Title Centra | |
| Bridgewater 3 Llc | -- | Accommodation | |
| Bridgewater 3 Llc | -- | Accommodation | |
| Long Term Land Holdings Inc | -- | Accommodation | |
| Long Term Land Holdings Inc | $5,664,593 | Accommodation |
Source: Public Records
Mortgage History
| Date | Status | Borrower | Loan Amount |
|---|---|---|---|
| Open | Alejandro Valentine I | $276,799 | |
| Closed | Alejandro Valentine I | $281,084 | |
| Closed | Alejandro Valentine I | $244,200 | |
| Previous Owner | Acoba Dorifel T | $210,482 |
Source: Public Records
Tax History Compared to Growth
Tax History
| Year | Tax Paid | Tax Assessment Tax Assessment Total Assessment is a certain percentage of the fair market value that is determined by local assessors to be the total taxable value of land and additions on the property. | Land | Improvement |
|---|---|---|---|---|
| 2025 | $3,443 | $154,201 | $42,000 | $112,201 |
| 2024 | $3,630 | $154,201 | $42,000 | $112,201 |
| 2023 | $3,630 | $145,319 | $40,250 | $105,069 |
| 2022 | $3,246 | $128,631 | $33,250 | $95,381 |
| 2021 | $3,157 | $107,354 | $31,500 | $75,854 |
| 2020 | $3,069 | $108,798 | $29,400 | $79,398 |
| 2019 | $3,032 | $107,472 | $26,250 | $81,222 |
| 2018 | $2,893 | $98,634 | $23,800 | $74,834 |
| 2017 | $2,951 | $100,606 | $23,450 | $77,156 |
| 2016 | $2,836 | $97,141 | $11,900 | $85,241 |
| 2015 | $2,962 | $10,850 | $10,850 | $0 |
| 2014 | $318 | $0 | $0 | $0 |
Source: Public Records
Map
Nearby Homes
- 9450 Niagara Landing St
- 5956 Lambert Bridge Ave
- 5850 Sonoma Station Ave
- 9435 Westwind Rd
- 5965 Sierra Medina Ave
- 6054 Sierra Medina Ave
- 5889 Thistle Meadow Ave
- 9656 Paraiso Springs St
- 5957 Pillar Rock Ave
- 5527 Middleton Falls Ave
- 9447 Mohawk St
- 5411 W Meranto Ave
- 9411 Mohawk St
- 5509 Middleton Falls Ave
- 5509 Middleton Falls Ave
- 5509 Middleton Falls Ave
- 5530 Argenta Habitat Ave
- 9268 Wildfire Gorge St
- 5477 W Meranto Ave
- 5661 Brimstone Hill Ave
- 9462 Niagara Landing St
- 9474 Niagara Landing St
- 9438 Niagara Landing St
- 9426 Niagara Landing St
- 5883 Laurel Lake Ct
- 9414 Niagara Landing St
- 5895 Laurel Lake Ct
- 5884 Laurel Lake Ct
- 9402 Niagara Landing St
- 5907 Laurel Lake Ct
- 5846 Belvedere Canyon Ave Unit 5
- 5858 Belvedere Canyon Ave
- 5896 Laurel Lake Ct
- 5870 Belvedere Canyon Ave
- 5834 Belvedere Canyon Ave
- 5882 Belvedere Canyon Ave
- 5908 Laurel Lake Ct
- 5919 Laurel Lake Ct
- 5822 Stoneheath Ave
- 5894 Belvedere Canyon Ave