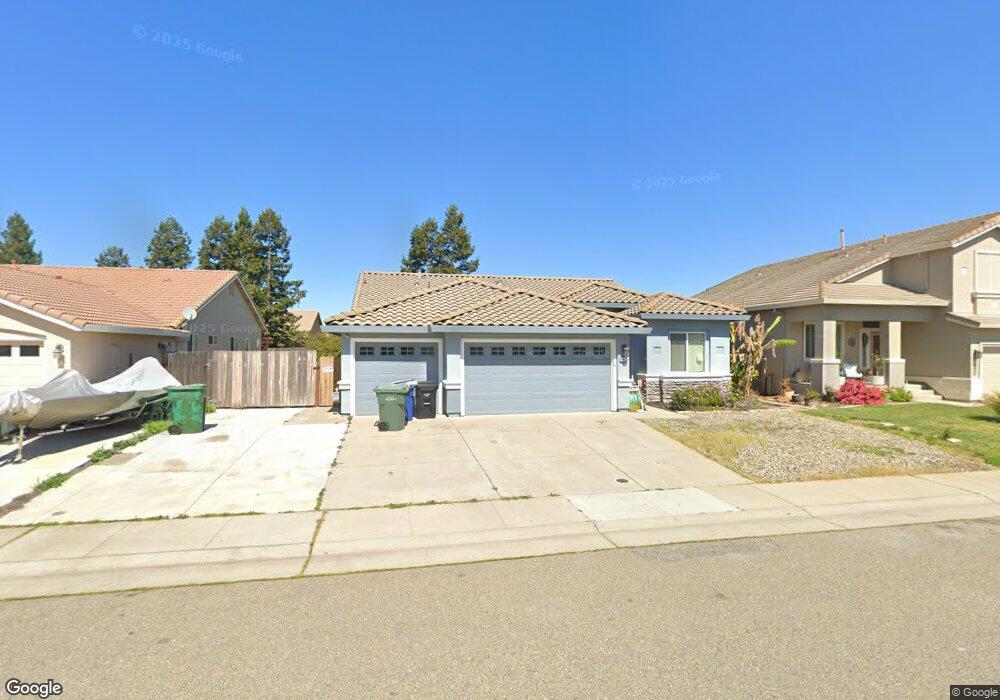
9465 9465 Pournelle Way Sacramento, CA 95829
Estimated Value: $582,848 - $655,000
4
Beds
2
Baths
1,965
Sq Ft
$313/Sq Ft
Est. Value
About This Home
This home is located at 9465 9465 Pournelle Way, Sacramento, CA 95829 and is currently estimated at $615,212, approximately $313 per square foot. 9465 9465 Pournelle Way is a home located in Sacramento County with nearby schools including Robert J. Fite Elementary School, T. R. Smedberg Middle School, and Sheldon High School.
Ownership History
Date
Name
Owned For
Owner Type
Purchase Details
Closed on
Sep 5, 2020
Sold by
Denney Judith A and Eileen B Engleman Trust
Bought by
Tuiletoa Tuavao
Current Estimated Value
Home Financials for this Owner
Home Financials are based on the most recent Mortgage that was taken out on this home.
Original Mortgage
$150,000
Outstanding Balance
$132,812
Interest Rate
2.9%
Mortgage Type
New Conventional
Estimated Equity
$482,400
Purchase Details
Closed on
Jun 26, 2002
Sold by
Elliot Homes Inc
Bought by
Engleman Eileen B and Eileen B Engleman Trust
Home Financials for this Owner
Home Financials are based on the most recent Mortgage that was taken out on this home.
Original Mortgage
$136,020
Interest Rate
6.86%
Create a Home Valuation Report for This Property
The Home Valuation Report is an in-depth analysis detailing your home's value as well as a comparison with similar homes in the area
Home Values in the Area
Average Home Value in this Area
Purchase History
| Date | Buyer | Sale Price | Title Company |
|---|---|---|---|
| Tuiletoa Tuavao | $459,500 | North American Title Co Inc | |
| Engleman Eileen B | $236,500 | Stewart Title |
Source: Public Records
Mortgage History
| Date | Status | Borrower | Loan Amount |
|---|---|---|---|
| Open | Tuiletoa Tuavao | $150,000 | |
| Previous Owner | Engleman Eileen B | $136,020 |
Source: Public Records
Tax History Compared to Growth
Tax History
| Year | Tax Paid | Tax Assessment Tax Assessment Total Assessment is a certain percentage of the fair market value that is determined by local assessors to be the total taxable value of land and additions on the property. | Land | Improvement |
|---|---|---|---|---|
| 2025 | $6,346 | $586,500 | $142,800 | $443,700 |
| 2024 | $6,346 | $575,000 | $140,000 | $435,000 |
| 2023 | $5,213 | $478,063 | $130,050 | $348,013 |
| 2022 | $8,941 | $468,690 | $127,500 | $341,190 |
| 2021 | $5,065 | $459,500 | $125,000 | $334,500 |
| 2020 | $3,559 | $318,799 | $60,777 | $258,022 |
| 2019 | $3,412 | $312,549 | $59,586 | $252,963 |
| 2018 | $3,319 | $306,421 | $58,418 | $248,003 |
| 2017 | $3,261 | $300,414 | $57,273 | $243,141 |
| 2016 | $3,095 | $294,524 | $56,150 | $238,374 |
| 2015 | $3,036 | $290,101 | $55,307 | $234,794 |
| 2014 | $2,985 | $284,419 | $54,224 | $230,195 |
Source: Public Records
Map
Nearby Homes
- 9244 Heathfield Way
- 8189 Scrimshaw Way
- 8210 Scrimshaw Way
- 9596 Rogers Rd
- 9492 Del Seis Dr
- 9633 Respect Dr
- 9401 Rogers Rd
- 9273 Amarone Way
- 9298 Helmingham Ct
- 9251 Framton Ct
- 9733 Everbloom Way
- 9251 Rogers Rd
- 9286 Fosdyke Ct
- 9264 Lucchesi Dr
- 9169 Garlington Ct
- 0 Admiral Ln Unit 225138021
- 0 Admiral Ln Unit 225138030
- 0 Admiral Ln Unit 225138010
- 8048 Caymus Dr
- 7776 Sikh Ct
- 9465 Pournelle Way
- 9471 Pournelle Way
- 9461 Pournelle Way
- 8044 Haldeman Way
- 8040 Haldeman Way
- 8048 Haldeman Way
- 9477 Pournelle Way
- 8036 Haldeman Way
- 9468 Pournelle Way
- 9464 Pournelle Way
- 9472 Pournelle Way
- 9460 Pournelle Way
- 9455 Pournelle Ct
- 9485 Pournelle Way
- 8056 Haldeman Ct
- 8032 Haldeman Way
- 9476 Pournelle Way
- 9456 Pournelle Ct
- 8041 Haldeman Way
- 8045 Haldeman Way