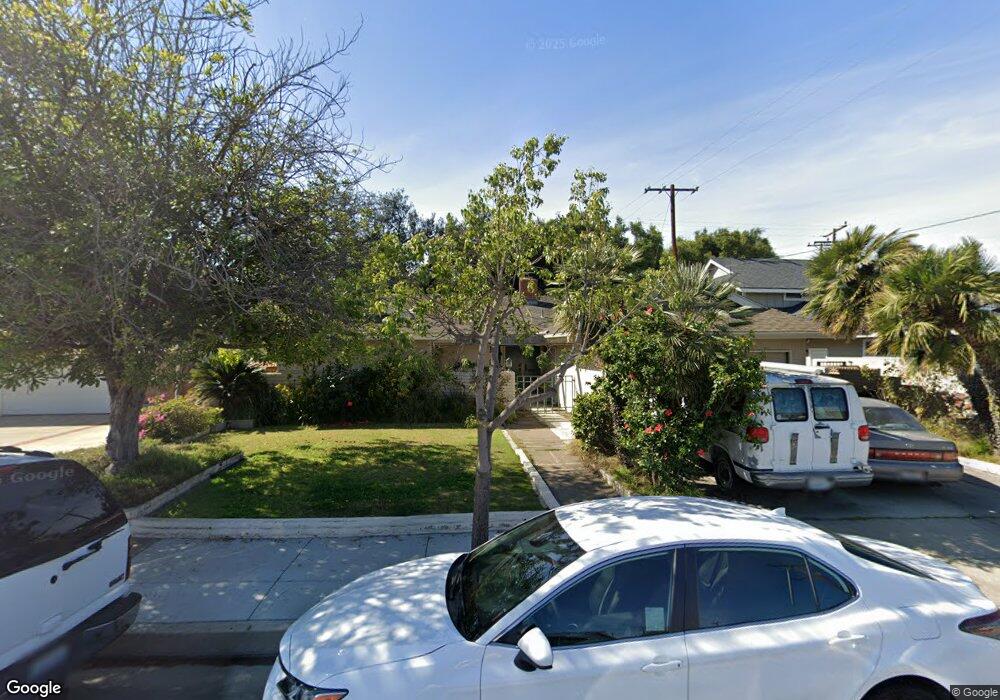
9465 Fernbury St Cypress, CA 90630
Estimated Value: $1,083,124 - $1,268,000
3
Beds
3
Baths
1,744
Sq Ft
$668/Sq Ft
Est. Value
About This Home
This home is located at 9465 Fernbury St, Cypress, CA 90630 and is currently estimated at $1,165,031, approximately $668 per square foot. 9465 Fernbury St is a home located in Orange County with nearby schools including A.E. Arnold Elementary School, Margaret Landell Elementary School, and Lexington Junior High School.
Ownership History
Date
Name
Owned For
Owner Type
Purchase Details
Closed on
Feb 19, 2010
Sold by
Ramirez Leo and Ramirez Jennifer
Bought by
Ramirez Leo and Ramirez Jennifer A
Current Estimated Value
Home Financials for this Owner
Home Financials are based on the most recent Mortgage that was taken out on this home.
Original Mortgage
$294,604
Outstanding Balance
$194,098
Interest Rate
4.94%
Mortgage Type
New Conventional
Estimated Equity
$970,933
Purchase Details
Closed on
Jan 31, 2003
Sold by
Walko Donald G and Walko Judith
Bought by
Ramirez Leo and Purcell Jennifer
Home Financials for this Owner
Home Financials are based on the most recent Mortgage that was taken out on this home.
Original Mortgage
$322,700
Interest Rate
5.85%
Purchase Details
Closed on
Jul 16, 2002
Sold by
Walko Judith
Bought by
Walko Donald G and Walko Judith
Purchase Details
Closed on
Mar 25, 1997
Sold by
Forkos Bernice
Bought by
Forkos Bernice
Create a Home Valuation Report for This Property
The Home Valuation Report is an in-depth analysis detailing your home's value as well as a comparison with similar homes in the area
Home Values in the Area
Average Home Value in this Area
Purchase History
| Date | Buyer | Sale Price | Title Company |
|---|---|---|---|
| Ramirez Leo | -- | Security Union Title Insuran | |
| Ramirez Leo | $420,000 | First American Title Co | |
| Walko Donald G | -- | -- | |
| Forkos Bernice | -- | -- |
Source: Public Records
Mortgage History
| Date | Status | Borrower | Loan Amount |
|---|---|---|---|
| Open | Ramirez Leo | $294,604 | |
| Closed | Ramirez Leo | $322,700 |
Source: Public Records
Tax History Compared to Growth
Tax History
| Year | Tax Paid | Tax Assessment Tax Assessment Total Assessment is a certain percentage of the fair market value that is determined by local assessors to be the total taxable value of land and additions on the property. | Land | Improvement |
|---|---|---|---|---|
| 2025 | $6,790 | $608,145 | $493,167 | $114,978 |
| 2024 | $6,790 | $596,221 | $483,497 | $112,724 |
| 2023 | $6,634 | $584,531 | $474,017 | $110,514 |
| 2022 | $6,557 | $573,070 | $464,722 | $108,348 |
| 2021 | $6,470 | $561,834 | $455,610 | $106,224 |
| 2020 | $6,445 | $556,074 | $450,939 | $105,135 |
| 2019 | $6,262 | $545,171 | $442,097 | $103,074 |
| 2018 | $6,177 | $534,482 | $433,429 | $101,053 |
| 2017 | $5,963 | $524,002 | $424,930 | $99,072 |
| 2016 | $5,912 | $513,728 | $416,598 | $97,130 |
| 2015 | $5,869 | $506,012 | $410,340 | $95,672 |
| 2014 | $5,555 | $496,100 | $402,302 | $93,798 |
Source: Public Records
Map
Nearby Homes
- 4741 Newman Ave
- 4644 Portofino Cir
- 9211 Julie Beth St
- 4819 Fieldbrook Ln
- 4615 Alekona Ct
- 4823 Fieldbrook Ln Unit 24
- 4223 Paseo de Plata
- 5000 Clementine Ln
- 7002 Citron Ln
- 4617 Alekona Ct
- 6007 Clementine Ln Unit 21
- Plan B1 at Citrus Square - Cerise
- Plan A2 at Citrus Square - Cerise
- Plan A1 at Citrus Square - Cerise
- Plan B1X at Citrus Square - Cerise
- 9080 Bloomfield Ave Unit 79
- 9080 Bloomfield Ave Unit 11
- 9080 Bloomfield Ave Unit 77
- 9080 Bloomfield Ave Unit 167
- 9080 Bloomfield Ave Unit 33
- 9455 Fernbury St
- 9475 Fernbury St
- 9445 Fernbury St
- 4641 Ashbury Ave
- 4622 Ashbury Ave
- 9456 Fernbury St
- 4588 Lemon Cir
- 4632 Ashbury Ave
- 9435 Fernbury St
- 4568 Lemon Cir
- 9446 Fernbury St
- 4661 Ashbury Ave
- 4642 Ashbury Ave
- 4558 Lemon Cir
- 9436 Fernbury St
- 4662 Ashbury Ave
- 9457 Danbury St
- 4671 Ashbury Ave
- 9447 Danbury St
- 4548 Lemon Cir