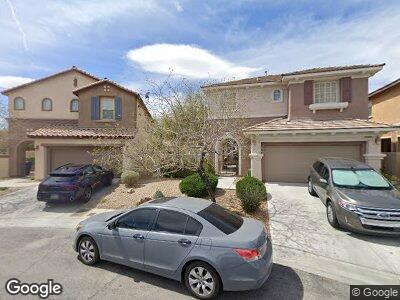
9469 Cormorant Lake Way Las Vegas, NV 89178
Mountains Edge NeighborhoodEstimated Value: $376,000 - $402,000
3
Beds
3
Baths
1,367
Sq Ft
$286/Sq Ft
Est. Value
About This Home
This home is located at 9469 Cormorant Lake Way, Las Vegas, NV 89178 and is currently estimated at $390,579, approximately $285 per square foot. 9469 Cormorant Lake Way is a home located in Clark County with nearby schools including Carolyn S. Reedom Elementary School, Desert Oasis High School, and Doral Academy Cactus.
Ownership History
Date
Name
Owned For
Owner Type
Purchase Details
Closed on
Jan 14, 2010
Sold by
Us Bank National Association
Bought by
Park Sang Woong and Ko Sari
Current Estimated Value
Home Financials for this Owner
Home Financials are based on the most recent Mortgage that was taken out on this home.
Original Mortgage
$110,953
Outstanding Balance
$76,546
Interest Rate
5.5%
Mortgage Type
FHA
Estimated Equity
$327,165
Purchase Details
Closed on
Jul 17, 2009
Sold by
Zamora Leny
Bought by
Us Bank National Association
Purchase Details
Closed on
Apr 4, 2006
Sold by
Greystone Nevada Llc
Bought by
Zamora Leny
Home Financials for this Owner
Home Financials are based on the most recent Mortgage that was taken out on this home.
Original Mortgage
$244,893
Interest Rate
8.6%
Mortgage Type
Balloon
Purchase Details
Closed on
Dec 2, 2005
Sold by
Us Home Corp
Bought by
Greystone Nevada Llc
Purchase Details
Closed on
Nov 28, 2005
Sold by
Acacia Credit Fund 9 & A Llc
Bought by
Us Home Corp
Create a Home Valuation Report for This Property
The Home Valuation Report is an in-depth analysis detailing your home's value as well as a comparison with similar homes in the area
Home Values in the Area
Average Home Value in this Area
Purchase History
| Date | Buyer | Sale Price | Title Company |
|---|---|---|---|
| Park Sang Woong | $120,000 | Chicago Title Las Vegas | |
| Us Bank National Association | $135,000 | Fidelity National Default So | |
| Zamora Leny | $306,117 | North American Title Co | |
| Greystone Nevada Llc | -- | -- | |
| Us Home Corp | $267,956 | Chicago Title |
Source: Public Records
Mortgage History
| Date | Status | Borrower | Loan Amount |
|---|---|---|---|
| Open | Park Sang Woong | $110,953 | |
| Previous Owner | Zamora Leny | $244,893 |
Source: Public Records
Tax History Compared to Growth
Tax History
| Year | Tax Paid | Tax Assessment Tax Assessment Total Assessment is a certain percentage of the fair market value that is determined by local assessors to be the total taxable value of land and additions on the property. | Land | Improvement |
|---|---|---|---|---|
| 2025 | $1,359 | $99,594 | $33,250 | $66,344 |
| 2024 | $1,268 | $99,594 | $33,250 | $66,344 |
| 2023 | $1,034 | $90,503 | $29,750 | $60,753 |
| 2022 | $1,231 | $79,878 | $24,500 | $55,378 |
| 2021 | $1,196 | $75,381 | $22,750 | $52,631 |
| 2020 | $1,158 | $75,516 | $23,450 | $52,066 |
| 2019 | $1,124 | $71,426 | $20,300 | $51,126 |
| 2018 | $1,091 | $65,768 | $16,800 | $48,968 |
| 2017 | $1,886 | $64,275 | $14,700 | $49,575 |
| 2016 | $1,034 | $54,343 | $11,900 | $42,443 |
| 2015 | $1,032 | $47,351 | $9,450 | $37,901 |
| 2014 | $999 | $33,031 | $4,900 | $28,131 |
Source: Public Records
Map
Nearby Homes
- 7941 Limestone Arch Ave
- 7937 Granite Walk Ave
- 7943 Sleeping Lily Dr
- 9611 Trattoria St
- 8093 Luna Sera Ave
- 9614 Stonily Ln
- 8178 Rock Meadows Dr
- 7851 Granite Walk Ave
- 8070 Pavarotti Ave
- 9622 Staff Ln
- 8156 Cheerful Valley Ave
- 9462 Alhambra Valley St
- 9343 Clear Day Ln
- 9162 Benton Woods St
- 9792 Crescent Lodge Ct
- 9156 Benton Woods St
- 9150 Benton Woods St
- 7977 Whisper Words Ave
- 7878 Brianna Cheerful Ave
- Buffalo Drive and Gomer Rd
- 9469 Cormorant Lake Way
- 9479 Cormorant Lake Way
- 9468 Diamond Willow Ct
- 9478 Diamond Willow Ct
- 9489 Cormorant Lake Way
- 8014 Whiteriver Plateau Ln
- 9488 Diamond Willow Ct
- 8020 Whiteriver Plateau Ln
- 9460 Cormorant Lake Way Unit n/a
- 9460 Cormorant Lake Way
- 9499 Cormorant Lake Way
- 9499 Cormorant Lake Way Unit n/a
- 8026 Whiteriver Plateau Ln
- 8026 Whiteriver Plateau Ln
- 8026 Whiteriver Plateau Ln
- 9498 Diamond Willow Ct
- 9454 Cormorant Lake Way
- 9483 Gypsum Quarry St
- 8015 Sundance Valley Dr
- 9467 Diamond Willow Ct