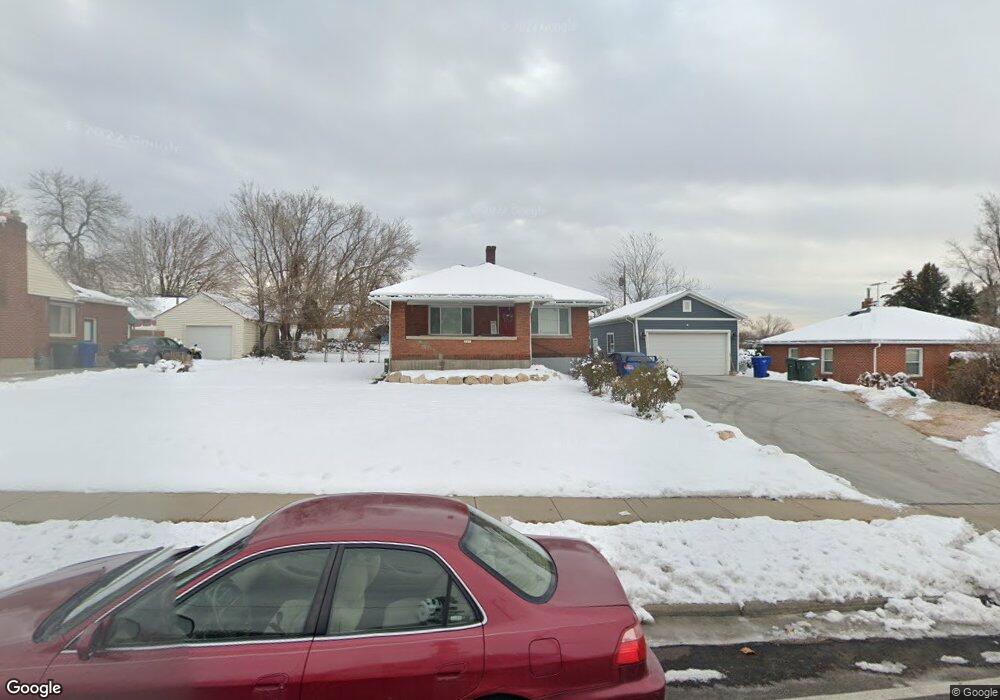
947 36th St Ogden, UT 84403
Southeast Ogden NeighborhoodEstimated Value: $372,000 - $410,000
4
Beds
2
Baths
2,240
Sq Ft
$176/Sq Ft
Est. Value
About This Home
This home is located at 947 36th St, Ogden, UT 84403 and is currently estimated at $395,315, approximately $176 per square foot. 947 36th St is a home located in Weber County with nearby schools including Shadow Valley School, Mount Ogden Junior High School, and Ogden High School.
Ownership History
Date
Name
Owned For
Owner Type
Purchase Details
Closed on
Sep 30, 2024
Sold by
Andrade Carlos
Bought by
Valenzuela Victor
Current Estimated Value
Home Financials for this Owner
Home Financials are based on the most recent Mortgage that was taken out on this home.
Original Mortgage
$77,569
Outstanding Balance
$76,775
Interest Rate
6.49%
Mortgage Type
FHA
Estimated Equity
$318,540
Purchase Details
Closed on
May 16, 2016
Bought by
Andrade Carlos
Home Financials for this Owner
Home Financials are based on the most recent Mortgage that was taken out on this home.
Original Mortgage
$71,250
Interest Rate
3.57%
Purchase Details
Closed on
Mar 18, 2011
Sold by
Clayton Margaret E
Bought by
El Nandu Enterprises Inc
Purchase Details
Closed on
Mar 3, 2005
Sold by
Castle Wayne Houghton
Bought by
Castle Wayne H and Clayton Margaret E
Create a Home Valuation Report for This Property
The Home Valuation Report is an in-depth analysis detailing your home's value as well as a comparison with similar homes in the area
Home Values in the Area
Average Home Value in this Area
Purchase History
| Date | Buyer | Sale Price | Title Company |
|---|---|---|---|
| Valenzuela Victor | -- | Us Title | |
| Andrade Carlos | -- | -- | |
| El Nandu Enterprises Inc | -- | First American Bountiful | |
| Castle Wayne H | -- | None Available |
Source: Public Records
Mortgage History
| Date | Status | Borrower | Loan Amount |
|---|---|---|---|
| Open | Valenzuela Victor | $77,569 | |
| Previous Owner | Andrade Carlos | $71,250 | |
| Previous Owner | Andrade Carlos | -- |
Source: Public Records
Tax History Compared to Growth
Tax History
| Year | Tax Paid | Tax Assessment Tax Assessment Total Assessment is a certain percentage of the fair market value that is determined by local assessors to be the total taxable value of land and additions on the property. | Land | Improvement |
|---|---|---|---|---|
| 2025 | $2,790 | $350,876 | $117,940 | $232,936 |
| 2024 | $2,774 | $188,649 | $64,867 | $123,782 |
| 2023 | $2,775 | $192,500 | $57,157 | $135,343 |
| 2022 | $3,108 | $222,201 | $48,809 | $173,392 |
| 2021 | $2,515 | $291,002 | $54,504 | $236,498 |
| 2020 | $2,247 | $237,001 | $41,076 | $195,925 |
| 2019 | $2,008 | $195,000 | $37,012 | $157,988 |
| 2018 | $1,783 | $169,000 | $32,679 | $136,321 |
| 2017 | $1,690 | $148,000 | $38,446 | $109,554 |
| 2016 | $1,510 | $70,052 | $17,565 | $52,487 |
| 2015 | $1,414 | $63,389 | $17,565 | $45,824 |
| 2014 | $1,376 | $17,659 | $17,565 | $94 |
Source: Public Records
Map
Nearby Homes
- 865 Maple St
- 1616 S Fowler Ave
- 3813 Grandview Dr
- 1066 35th St
- 3828 Quincy Ave
- 749 37th St
- 3409 Jackson Ave
- 835 Franklin St
- 3830 Oram Cir
- 3864 S Quincy Ave Unit 119
- 4615 S Monroe Blvd
- 3868 Grandview Dr
- 3476 Brinker Ave
- 3880 Raymond Ave
- 3556 Orchard Ave
- 3374 Eccles Ave
- 3305 Quincy Ave
- 964 40th St
- 612 35th St
- 3760 Jefferson Ave