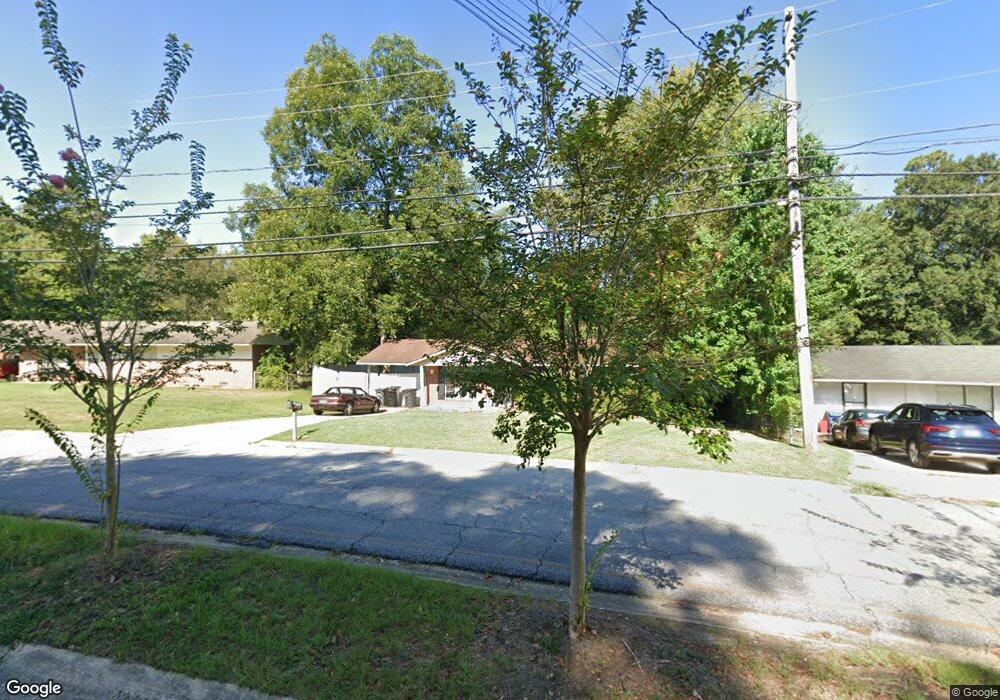
947 Belvedere Dr Columbus, GA 31907
Eastern Columbus NeighborhoodEstimated Value: $131,000 - $171,000
3
Beds
3
Baths
1,197
Sq Ft
$130/Sq Ft
Est. Value
About This Home
This home is located at 947 Belvedere Dr, Columbus, GA 31907 and is currently estimated at $155,316, approximately $129 per square foot. 947 Belvedere Dr is a home located in Muscogee County with nearby schools including Lonnie Jackson Academy, East Columbus Magnet Academy, and Kendrick High School.
Ownership History
Date
Name
Owned For
Owner Type
Purchase Details
Closed on
Feb 8, 2024
Sold by
Family Snowball Llc
Bought by
Correia Chelsea and Correia Javen
Current Estimated Value
Home Financials for this Owner
Home Financials are based on the most recent Mortgage that was taken out on this home.
Original Mortgage
$114,000
Outstanding Balance
$111,989
Interest Rate
6.62%
Mortgage Type
New Conventional
Estimated Equity
$43,327
Purchase Details
Closed on
Nov 13, 2023
Sold by
Alexander Daniel
Bought by
Family Snowball Llc
Purchase Details
Closed on
May 16, 2018
Sold by
Anthony Bevis
Bought by
Alexander Daniel
Purchase Details
Closed on
Sep 20, 2011
Sold by
Deal Dennis R
Bought by
Bevis Anthony
Purchase Details
Closed on
Aug 13, 2007
Sold by
Moody Frank
Bought by
Deal Dennis R
Purchase Details
Closed on
Jun 5, 2007
Sold by
Fortson Herman
Bought by
Moody Frank
Create a Home Valuation Report for This Property
The Home Valuation Report is an in-depth analysis detailing your home's value as well as a comparison with similar homes in the area
Home Values in the Area
Average Home Value in this Area
Purchase History
| Date | Buyer | Sale Price | Title Company |
|---|---|---|---|
| Correia Chelsea | $152,000 | None Listed On Document | |
| Family Snowball Llc | $40,000 | None Listed On Document | |
| Alexander Daniel | -- | -- | |
| Bevis Anthony | $82,000 | -- | |
| Deal Dennis R | $67,200 | None Available | |
| Moody Frank | $60,901 | None Available |
Source: Public Records
Mortgage History
| Date | Status | Borrower | Loan Amount |
|---|---|---|---|
| Open | Correia Chelsea | $114,000 |
Source: Public Records
Tax History Compared to Growth
Tax History
| Year | Tax Paid | Tax Assessment Tax Assessment Total Assessment is a certain percentage of the fair market value that is determined by local assessors to be the total taxable value of land and additions on the property. | Land | Improvement |
|---|---|---|---|---|
| 2025 | $2,218 | $56,668 | $6,732 | $49,936 |
| 2024 | $2,217 | $56,636 | $6,732 | $49,904 |
| 2023 | $1,400 | $35,540 | $6,732 | $28,808 |
| 2022 | $1,120 | $27,436 | $6,732 | $20,704 |
| 2021 | $994 | $24,272 | $6,732 | $17,540 |
| 2020 | $991 | $24,272 | $6,732 | $17,540 |
| 2019 | $994 | $24,272 | $6,732 | $17,540 |
| 2018 | $815 | $24,272 | $6,732 | $17,540 |
| 2017 | $853 | $24,272 | $6,732 | $17,540 |
| 2016 | $824 | $33,236 | $3,336 | $29,900 |
| 2015 | $330 | $33,236 | $3,336 | $29,900 |
| 2014 | $331 | $33,236 | $3,336 | $29,900 |
| 2013 | -- | $33,236 | $3,336 | $29,900 |
Source: Public Records
Map
Nearby Homes
- 4722 Pollman St
- 822 Reaper Ln
- 5526 Buena Vista Rd
- 5529 Pollman St
- 5532 Buena Vista Rd
- 752 Wilder Dr
- 727 Wilder Dr
- 736 Belvedere Dr
- 719 Wilder Dr
- 5542 Teresa St
- 4731 Marino St
- 4935 Buena Vista Rd
- 5035 Gibbs Dr
- 4903 Chapman St
- 702 Corley Dr
- 908 Arlington Dr
- 1354 Floyd Rd
- 4804 Bruning St
- 960 Lake Rushin Dr
- 5828 Georgetown Dr
- 951 Belvedere Dr
- 941 Belvedere Dr
- 935 Belvedere Dr
- 5330 Buena Vista Rd
- 959 Belvedere Dr
- 931 Belvedere Dr
- 940 Belvedere Dr
- 952 Belvedere Dr
- 5316 Buena Vista Rd
- 5306 Buena Vista Rd
- 898 Baxley Way
- 925 Belvedere Dr
- 5412 Buena Vista Rd
- 1102 Thyer Ave
- 919 Belvedere Dr
- 890 Baxley Way
- 897 Baxley Way
- 5418 Buena Vista Rd
- 913 Belvedere Dr
- 5313 Buena Vista Rd