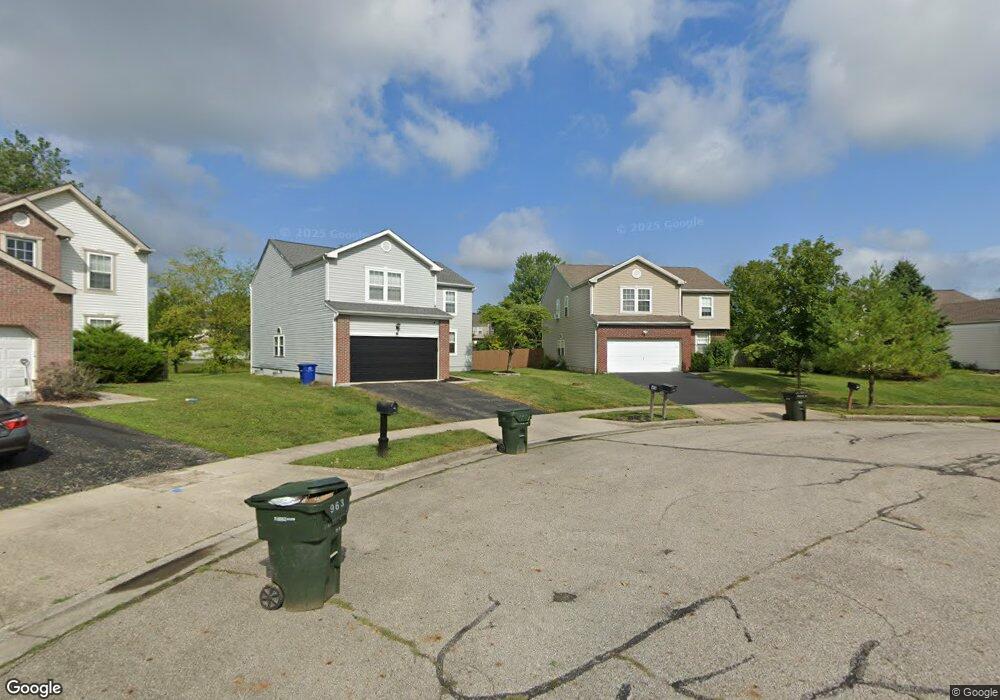
947 Drayson Dr Galloway, OH 43119
Westbend NeighborhoodEstimated Value: $326,000 - $377,000
4
Beds
3
Baths
2,582
Sq Ft
$138/Sq Ft
Est. Value
About This Home
This home is located at 947 Drayson Dr, Galloway, OH 43119 and is currently estimated at $356,779, approximately $138 per square foot. 947 Drayson Dr is a home located in Franklin County with nearby schools including Georgian Heights Alt Elementary School, Wedgewood Middle School, and Briggs High School.
Ownership History
Date
Name
Owned For
Owner Type
Purchase Details
Closed on
May 27, 2015
Sold by
Allen Robert J
Bought by
Allen Roberrt J and Stansberry Connie Jo
Current Estimated Value
Home Financials for this Owner
Home Financials are based on the most recent Mortgage that was taken out on this home.
Original Mortgage
$131,750
Outstanding Balance
$46,882
Interest Rate
3.82%
Mortgage Type
New Conventional
Estimated Equity
$309,897
Purchase Details
Closed on
Aug 28, 2009
Sold by
Redley Joseph L and Redley Donna M
Bought by
Allen Robert J
Home Financials for this Owner
Home Financials are based on the most recent Mortgage that was taken out on this home.
Original Mortgage
$154,151
Interest Rate
5.27%
Mortgage Type
FHA
Purchase Details
Closed on
Jul 2, 2002
Sold by
Maronda Homes Inc Of Ohio
Bought by
Redley Joseph L and Redley Donna M
Home Financials for this Owner
Home Financials are based on the most recent Mortgage that was taken out on this home.
Original Mortgage
$169,606
Interest Rate
6.79%
Mortgage Type
FHA
Create a Home Valuation Report for This Property
The Home Valuation Report is an in-depth analysis detailing your home's value as well as a comparison with similar homes in the area
Home Values in the Area
Average Home Value in this Area
Purchase History
| Date | Buyer | Sale Price | Title Company |
|---|---|---|---|
| Allen Roberrt J | -- | None Available | |
| Allen Robert J | $123,100 | Attorney | |
| Redley Joseph L | $173,000 | Chicago Title |
Source: Public Records
Mortgage History
| Date | Status | Borrower | Loan Amount |
|---|---|---|---|
| Open | Allen Roberrt J | $131,750 | |
| Closed | Allen Robert J | $154,151 | |
| Previous Owner | Redley Joseph L | $169,606 |
Source: Public Records
Tax History
| Year | Tax Paid | Tax Assessment Tax Assessment Total Assessment is a certain percentage of the fair market value that is determined by local assessors to be the total taxable value of land and additions on the property. | Land | Improvement |
|---|---|---|---|---|
| 2025 | $4,540 | $101,150 | $26,460 | $74,690 |
| 2024 | $4,540 | $101,150 | $26,460 | $74,690 |
| 2023 | $4,482 | $101,150 | $26,460 | $74,690 |
| 2022 | $3,547 | $68,390 | $9,240 | $59,150 |
| 2021 | $3,553 | $68,390 | $9,240 | $59,150 |
| 2020 | $3,558 | $68,390 | $9,240 | $59,150 |
| 2019 | $3,389 | $55,860 | $7,700 | $48,160 |
| 2018 | $3,253 | $55,860 | $7,700 | $48,160 |
| 2017 | $3,414 | $55,860 | $7,700 | $48,160 |
| 2016 | $3,441 | $51,950 | $8,090 | $43,860 |
| 2015 | $3,124 | $51,950 | $8,090 | $43,860 |
| 2014 | $3,132 | $51,950 | $8,090 | $43,860 |
| 2013 | $1,626 | $54,670 | $8,505 | $46,165 |
Source: Public Records
Map
Nearby Homes
- 6059 Chidley St
- 765 Sumter St
- 859 Lescar Ln
- 683 Perilous Place Unit 3
- 6173 Streaming Ave Unit 192
- 628 Penn St Unit 67
- 706 Windy Hill Ln
- 569 Perilous Place Unit 22
- 569 Perilous Place
- 773 Rothrock Dr
- 815 Bledsoe Dr
- 1581 Galloway Rd
- Pendleton Plan at Chase Landings
- Bellamy Plan at Chase Landings
- Chatham Plan at Chase Landings
- Salem Plan at Chase Landings
- Lyndhurst Plan at Chase Landings
- Henley Plan at Chase Landings
- Sienna Plan at Chase Landings
- Harmony Plan at Chase Landings
- 939 Drayson Dr
- 955 Drayson Dr
- 931 Drayson Dr
- 963 Drayson Dr
- 923 Drayson Dr
- 971 Drayson Dr
- 916 Meadow Downs Trail
- 916 Meadow Downs Trail Unit 106
- 922 Meadow Downs Trail
- 910 Meadow Downs Trail
- 928 Meadow Downs Trail
- 915 Drayson Dr
- 932 Drayson Dr
- 979 Drayson Dr
- 904 Meadow Downs Trail
- 934 Meadow Downs Trail
- 956 Drayson Dr
- 964 Drayson Dr
- 940 Meadow Downs Trail
- 898 Meadow Downs Trail
Your Personal Tour Guide
Ask me questions while you tour the home.