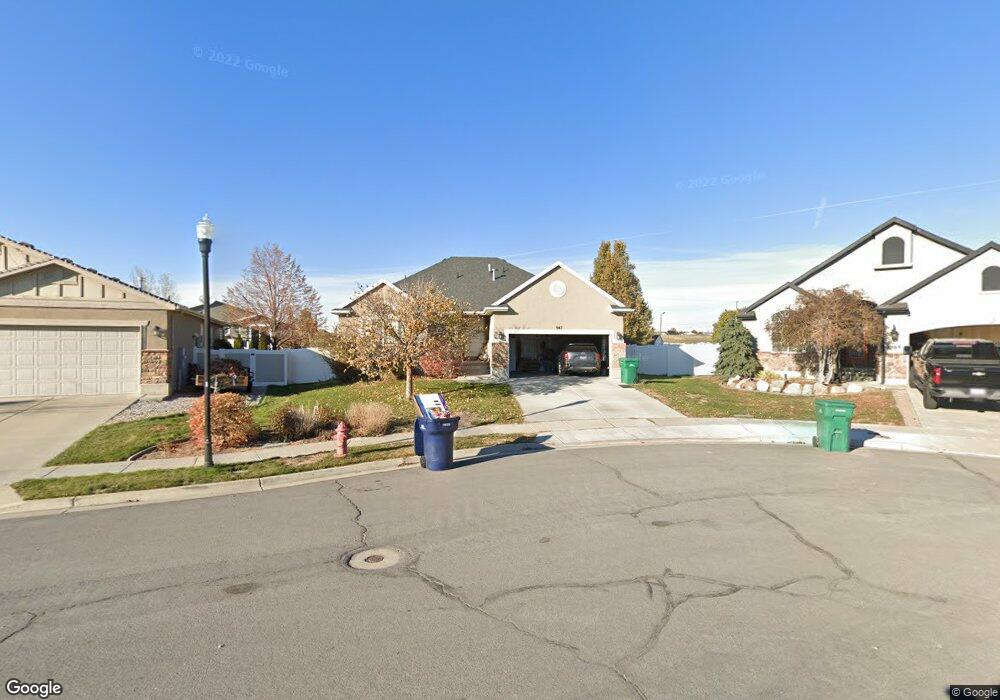
947 E Sam Cir Clearfield, UT 84015
Estimated Value: $535,000 - $570,000
6
Beds
3
Baths
2,743
Sq Ft
$200/Sq Ft
Est. Value
About This Home
This home is located at 947 E Sam Cir, Clearfield, UT 84015 and is currently estimated at $549,794, approximately $200 per square foot. 947 E Sam Cir is a home located in Davis County with nearby schools including South Clearfield Elementary School, North Davis Junior High School, and Clearfield High School.
Ownership History
Date
Name
Owned For
Owner Type
Purchase Details
Closed on
Mar 10, 2020
Sold by
Thomas David L
Bought by
Thomas David L
Current Estimated Value
Home Financials for this Owner
Home Financials are based on the most recent Mortgage that was taken out on this home.
Original Mortgage
$319,000
Outstanding Balance
$281,912
Interest Rate
3.5%
Mortgage Type
New Conventional
Estimated Equity
$267,882
Purchase Details
Closed on
Jun 20, 2018
Sold by
Bell Nathan and Bell Jill
Bought by
Thomas David L
Home Financials for this Owner
Home Financials are based on the most recent Mortgage that was taken out on this home.
Original Mortgage
$318,250
Interest Rate
4.6%
Mortgage Type
New Conventional
Purchase Details
Closed on
May 19, 2010
Sold by
Ivory Homes Ltd
Bought by
Bell Nathan and Mayfield Shawna Jill
Home Financials for this Owner
Home Financials are based on the most recent Mortgage that was taken out on this home.
Original Mortgage
$226,450
Interest Rate
5.5%
Mortgage Type
FHA
Create a Home Valuation Report for This Property
The Home Valuation Report is an in-depth analysis detailing your home's value as well as a comparison with similar homes in the area
Home Values in the Area
Average Home Value in this Area
Purchase History
| Date | Buyer | Sale Price | Title Company |
|---|---|---|---|
| Thomas David L | -- | Inwest Title Servic | |
| Thomas David L | -- | Advantage Title | |
| Bell Nathan | -- | Cottonwood Title Ins Agency | |
| Ivory Homes Ltd | -- | Cottonwood Title Ins Agency |
Source: Public Records
Mortgage History
| Date | Status | Borrower | Loan Amount |
|---|---|---|---|
| Open | Thomas David L | $319,000 | |
| Closed | Thomas David L | $318,250 | |
| Previous Owner | Bell Nathan | $226,450 |
Source: Public Records
Tax History
| Year | Tax Paid | Tax Assessment Tax Assessment Total Assessment is a certain percentage of the fair market value that is determined by local assessors to be the total taxable value of land and additions on the property. | Land | Improvement |
|---|---|---|---|---|
| 2025 | $3,106 | $278,300 | $73,665 | $204,635 |
| 2024 | $3,010 | $271,700 | $70,417 | $201,283 |
| 2023 | $2,770 | $459,000 | $112,552 | $346,448 |
| 2022 | $3,013 | $270,050 | $64,333 | $205,717 |
| 2021 | $2,814 | $381,000 | $69,058 | $311,942 |
| 2020 | $2,447 | $329,000 | $58,200 | $270,800 |
| 2019 | $2,471 | $328,000 | $60,541 | $267,459 |
| 2018 | $2,119 | $274,000 | $53,736 | $220,264 |
| 2016 | $1,881 | $127,160 | $21,509 | $105,651 |
| 2015 | $1,857 | $119,680 | $21,509 | $98,171 |
| 2014 | $1,840 | $120,217 | $21,509 | $98,708 |
| 2013 | -- | $120,545 | $33,660 | $86,885 |
Source: Public Records
Map
Nearby Homes
- 1916 N Celia Way
- 668 E 2000 S
- 1740 N Gregory Dr
- 460 E 1700 S Unit 1 & 2
- 1896 Cliff Place
- 1477 N 2375 W
- 1596 N Main St Unit 2
- 1847 John St
- 1430 N 2100 W
- 308 E 1925 S
- 1491 N 1875 W
- 1491 N 1875 W Unit 158
- 1487 N 1875 W
- 1487 N 1875 W Unit 159
- 1483 N 1875 W
- 1479 N 1875 W
- 1479 N 1875 W Unit 161
- 1475 N 1875 W
- 1471 N 1875 W
- 1471 N 1875 W Unit 163
- 939 E Sam Cir
- 1905 S Sam Cir
- 946 E Chris Cir
- 936 E Chris Cir
- 927 E Sam Cir
- 927 E 1900 S
- 1913 S Sam Cir
- 926 E Chris Cir
- 926 E Chris Cir
- 1847 S Chris Cir
- 942 E Sam Cir
- 942 E Sam Cir
- 1921 S Sam Cir
- 917 E Sam Cir
- 914 E Chris Cir
- 914 E Chris Cir
- 930 E Sam Cir
- 1829 S Chris Cir
- 1829 S Chris Cir
- 1929 S Sam Cir
Your Personal Tour Guide
Ask me questions while you tour the home.