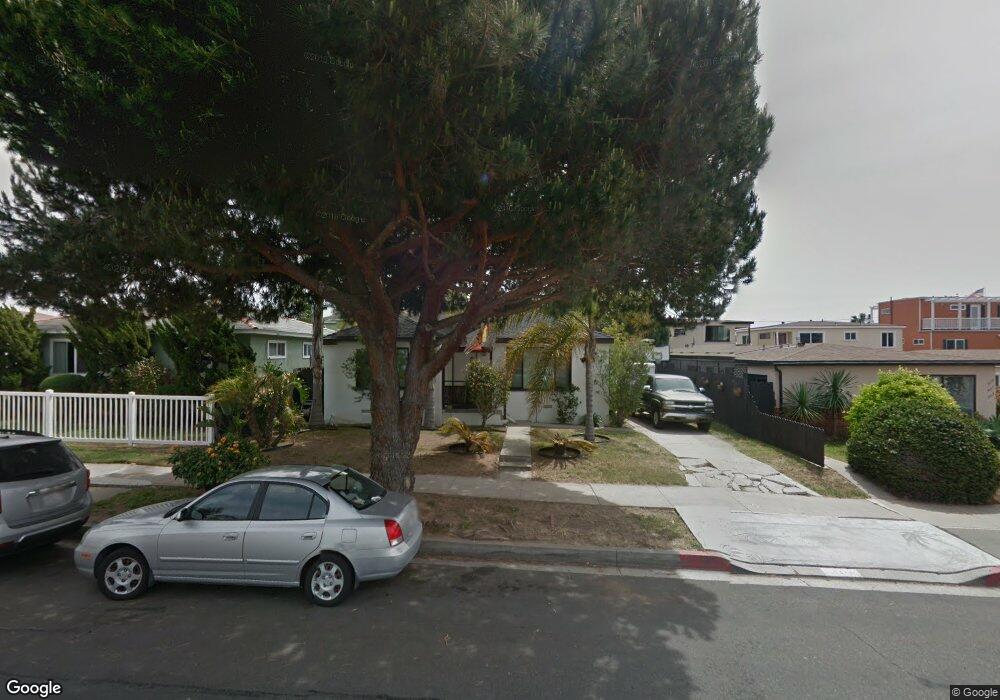
947 Tourmaline St San Diego, CA 92109
Pacific Beach NeighborhoodEstimated Value: $1,636,181 - $2,087,000
3
Beds
1
Bath
1,010
Sq Ft
$1,873/Sq Ft
Est. Value
About This Home
This home is located at 947 Tourmaline St, San Diego, CA 92109 and is currently estimated at $1,892,045, approximately $1,873 per square foot. 947 Tourmaline St is a home located in San Diego County with nearby schools including Pacific Beach Elementary School, Pacific Beach Middle, and Mission Bay High School.
Ownership History
Date
Name
Owned For
Owner Type
Purchase Details
Closed on
Mar 7, 2002
Sold by
Gawle Kevin Brent
Bought by
Gawle Brian Keith and Byun Katie
Current Estimated Value
Home Financials for this Owner
Home Financials are based on the most recent Mortgage that was taken out on this home.
Original Mortgage
$391,000
Outstanding Balance
$152,389
Interest Rate
6.25%
Estimated Equity
$1,739,656
Purchase Details
Closed on
Feb 13, 2002
Sold by
Gawle Brian Keith and Byun Katie
Bought by
Bruno Michael A
Home Financials for this Owner
Home Financials are based on the most recent Mortgage that was taken out on this home.
Original Mortgage
$391,000
Outstanding Balance
$152,389
Interest Rate
6.25%
Estimated Equity
$1,739,656
Purchase Details
Closed on
Apr 7, 1999
Sold by
Steel Fred W
Bought by
Gawle Kevin Brent
Home Financials for this Owner
Home Financials are based on the most recent Mortgage that was taken out on this home.
Original Mortgage
$180,000
Interest Rate
7.05%
Create a Home Valuation Report for This Property
The Home Valuation Report is an in-depth analysis detailing your home's value as well as a comparison with similar homes in the area
Home Values in the Area
Average Home Value in this Area
Purchase History
| Date | Buyer | Sale Price | Title Company |
|---|---|---|---|
| Gawle Brian Keith | -- | Fidelity National Title | |
| Bruno Michael A | $490,000 | Fidelity National Title | |
| Gawle Kevin Brent | $225,000 | Old Republic Title Company |
Source: Public Records
Mortgage History
| Date | Status | Borrower | Loan Amount |
|---|---|---|---|
| Open | Bruno Michael A | $391,000 | |
| Previous Owner | Gawle Kevin Brent | $180,000 | |
| Closed | Bruno Michael A | $73,500 |
Source: Public Records
Tax History Compared to Growth
Tax History
| Year | Tax Paid | Tax Assessment Tax Assessment Total Assessment is a certain percentage of the fair market value that is determined by local assessors to be the total taxable value of land and additions on the property. | Land | Improvement |
|---|---|---|---|---|
| 2025 | $8,664 | $723,853 | $616,629 | $107,224 |
| 2024 | $8,664 | $709,661 | $604,539 | $105,122 |
| 2023 | $8,471 | $695,747 | $592,686 | $103,061 |
| 2022 | $8,245 | $682,106 | $581,065 | $101,041 |
| 2021 | $8,187 | $668,732 | $569,672 | $99,060 |
| 2020 | $8,087 | $661,876 | $563,831 | $98,045 |
| 2019 | $7,941 | $648,899 | $552,776 | $96,123 |
| 2018 | $7,423 | $636,177 | $541,938 | $94,239 |
| 2017 | $80 | $623,704 | $531,312 | $92,392 |
| 2016 | $7,128 | $611,476 | $520,895 | $90,581 |
| 2015 | $7,022 | $602,292 | $513,071 | $89,221 |
| 2014 | $6,910 | $590,495 | $503,021 | $87,474 |
Source: Public Records
Map
Nearby Homes
- 972 Sapphire St Unit LA1
- 976 Sapphire St Unit LA3
- 5061 Mission Blvd
- 4944 Cass St Unit 1003
- 4944 Cass St Unit 409
- 4944 Cass St Unit 407
- 4975 Dawes St
- 1154 Sapphire St
- 751-63 Turquoise St Unit 27-30
- 727 Sapphire St Unit 301
- 4918 Dawes St Unit 3
- 1148 Turquoise St
- 819 Van Nuys St
- 1040 Van Nuys St
- 1235 Wilbur Ave
- 5209 Foothill Blvd
- 5416 Candlelight Dr
- 5490 Rutgers Rd
- 911 Missouri St Unit 8
- 5452 Moonlight Ln
- 939 Tourmaline St Unit 43
- 955 Tourmaline St Unit 57
- 933 Tourmaline St Unit 37
- 961 Tourmaline St Unit 65
- 944 Opal St
- 5075 Bayard St Unit 81
- 950 Opal St Unit 54
- 956 Opal St Unit 62
- 967 Tourmaline St Unit 75
- 964 Opal St Unit A
- 964 Opal St Unit D
- 964 Opal St Unit C
- 964 Opal St Unit B
- 928 Opal St
- 936 Opal St
- 964 Tourmaline St Unit 66
- 938 Opal St
- 952 Tourmaline St Unit 58
- 960 Opal St
- 944 Tourmaline St Unit 50