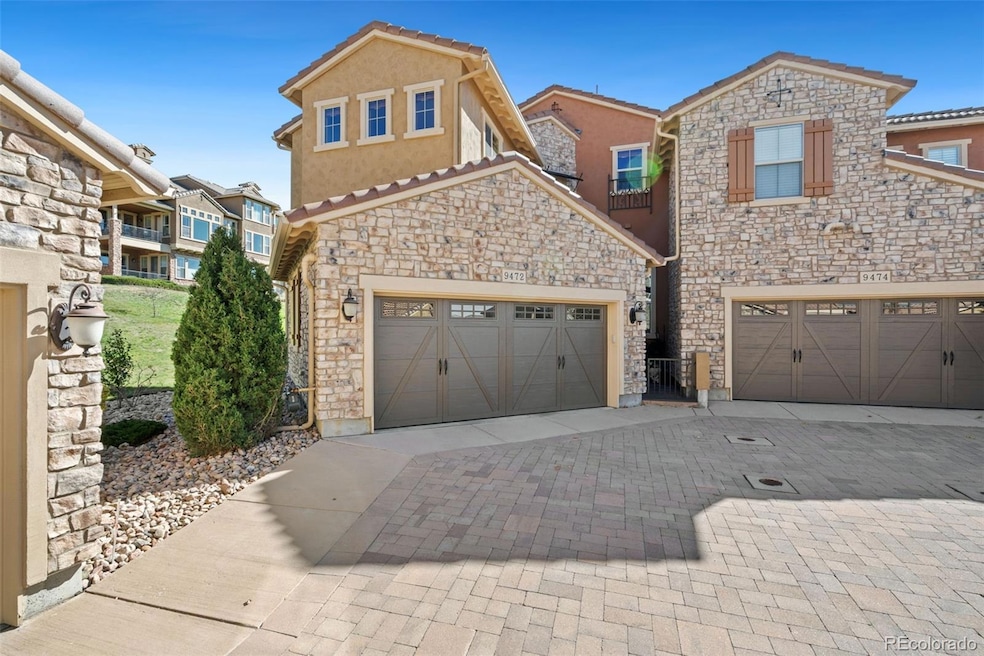
9472 Sori Ln Highlands Ranch, CO 80126
Northridge NeighborhoodEstimated payment $5,439/month
Highlights
- Outdoor Pool
- Located in a master-planned community
- Open Floorplan
- Sand Creek Elementary School Rated A-
- Primary Bedroom Suite
- Deck
About This Home
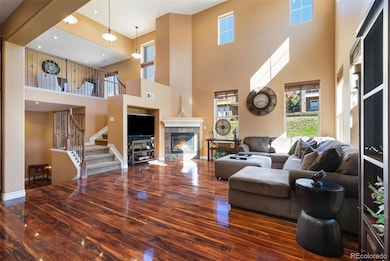
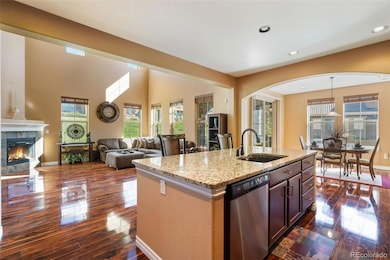
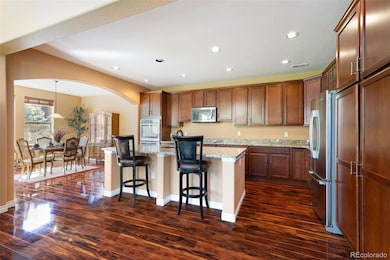
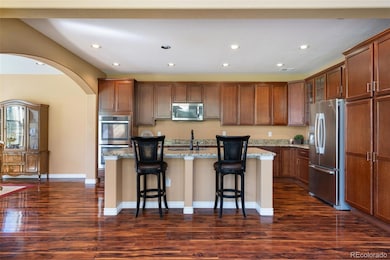
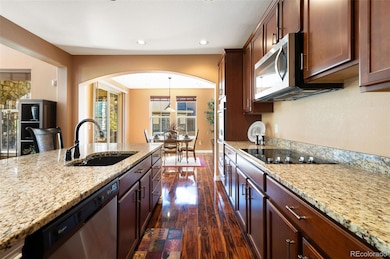
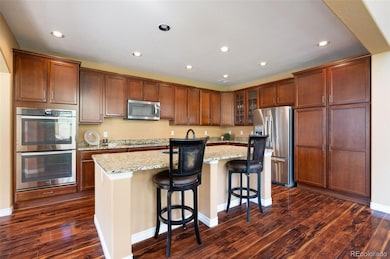
Welcome to 9472 Sori Lane — a beautifully updated Cellini model townhome in the highly coveted Tresana community of Highlands Ranch. This rare floor plan combines elegance and ease with 2 spacious bedrooms, 3 full bathrooms, and a versatile main-floor office that can also serve as a non-conforming bedroom. Enter through the inviting front courtyard into a light-filled foyer that sets the tone for the rest of the home. The main level includes a private office and full bath — ideal for guests, remote work, or a quiet flex space. The open-concept living area is beautifully designed for connection and comfort, featuring a cozy fireplace, a stylish dining area, a gourmet kitchen with an oversized island, dual ovens and high-end finishes. Your private patio is the perfect spot for a morning cup of coffee or evening unwinding under the Colorado sky.?Upstairs, the spacious loft offers endless flexibility — perfect for a reading nook, home gym, or media space. The guest suite includes a private en-suite bath, while the luxurious primary suite features a balcony, walk-in closet, and spa-inspired five-piece bath with upgraded tile and finishes. Additional highlights of this stunning home includes a 2-car attached garage, low-maintenance living, and access to the Tresana community amenities, including a private pool and hot tub right outside your front door— plus miles of walking trails, nearby shops and restaurants, and convenient access to C-470 and Highlands Ranch Town and Rec Centers.
Listing Agent
West and Main Homes Inc Brokerage Email: Lisa@westandmainhomes.com,720-276-7480 License #100067466 Listed on: 10/23/2025

Townhouse Details
Home Type
- Townhome
Est. Annual Taxes
- $5,360
Year Built
- Built in 2015
Lot Details
- 2,875 Sq Ft Lot
- 1 Common Wall
- Cul-De-Sac
- Landscaped
HOA Fees
Parking
- 2 Car Attached Garage
- Epoxy
Home Design
- Contemporary Architecture
- Slab Foundation
- Frame Construction
- Concrete Roof
- Stone Siding
- Stucco
Interior Spaces
- 2,422 Sq Ft Home
- Multi-Level Property
- Open Floorplan
- Furnished
- Built-In Features
- Vaulted Ceiling
- Ceiling Fan
- Gas Fireplace
- Entrance Foyer
- Living Room with Fireplace
- Dining Room
- Loft
- Home Security System
Kitchen
- Eat-In Kitchen
- Double Oven
- Range
- Microwave
- Dishwasher
- Kitchen Island
- Granite Countertops
- Disposal
Flooring
- Carpet
- Tile
- Vinyl
Bedrooms and Bathrooms
- Primary Bedroom Suite
- En-Suite Bathroom
- Walk-In Closet
- 3 Full Bathrooms
Laundry
- Laundry Room
- Dryer
- Washer
Outdoor Features
- Outdoor Pool
- Balcony
- Deck
- Covered Patio or Porch
- Outdoor Gas Grill
- Rain Gutters
Schools
- Sand Creek Elementary School
- Mountain Ridge Middle School
- Mountain Vista High School
Utilities
- Forced Air Heating and Cooling System
- Heating System Uses Natural Gas
- Natural Gas Connected
- Phone Available
- Cable TV Available
Additional Features
- Smoke Free Home
- Ground Level
Listing and Financial Details
- Exclusions: Seller's personal property.
- Assessor Parcel Number R0469615
Community Details
Overview
- Association fees include reserves, irrigation, ground maintenance, maintenance structure, recycling, snow removal, trash
- Highlands Ranch Community Association, Phone Number (303) 791-2500
- Tresana Townhomes Association, Phone Number (720) 974-4228
- Tresana Amenities Association, Inc. Association
- Built by Shea Homes
- Tresana Subdivision
- Located in a master-planned community
- Greenbelt
Recreation
- Tennis Courts
- Community Playground
- Community Pool
- Community Spa
- Park
- Trails
Pet Policy
- Pets Allowed
Security
- Fire and Smoke Detector
Map
Home Values in the Area
Average Home Value in this Area
Tax History
| Year | Tax Paid | Tax Assessment Tax Assessment Total Assessment is a certain percentage of the fair market value that is determined by local assessors to be the total taxable value of land and additions on the property. | Land | Improvement |
|---|---|---|---|---|
| 2024 | $5,360 | $60,560 | $7,370 | $53,190 |
| 2023 | $5,350 | $60,560 | $7,370 | $53,190 |
| 2022 | $4,234 | $46,340 | $2,090 | $44,250 |
| 2021 | $4,403 | $46,340 | $2,090 | $44,250 |
| 2020 | $4,069 | $43,870 | $2,150 | $41,720 |
| 2019 | $4,084 | $43,870 | $2,150 | $41,720 |
| 2018 | $3,764 | $39,830 | $2,160 | $37,670 |
| 2017 | $3,428 | $39,830 | $2,160 | $37,670 |
| 2016 | $3,293 | $4,340 | $2,390 | $1,950 |
| 2015 | $389 | $4,340 | $2,390 | $1,950 |
| 2014 | -- | $6,790 | $6,790 | $0 |
Property History
| Date | Event | Price | List to Sale | Price per Sq Ft |
|---|---|---|---|---|
| 11/18/2025 11/18/25 | Price Changed | $835,000 | -1.2% | $345 / Sq Ft |
| 11/11/2025 11/11/25 | Price Changed | $845,000 | -0.6% | $349 / Sq Ft |
| 10/27/2025 10/27/25 | Price Changed | $850,000 | -2.9% | $351 / Sq Ft |
| 10/23/2025 10/23/25 | For Sale | $875,000 | -- | $361 / Sq Ft |
Purchase History
| Date | Type | Sale Price | Title Company |
|---|---|---|---|
| Warranty Deed | $472,413 | Fidelity National Title | |
| Warranty Deed | $283,000 | Land Title |
Mortgage History
| Date | Status | Loan Amount | Loan Type |
|---|---|---|---|
| Open | $417,000 | New Conventional | |
| Previous Owner | $226,400 | Unknown |
Source: REcolorado®
MLS Number: 6505648
APN: 2229-122-13-005
Disclaimer: Certain information contained herein is derived from information provided by parties other than Homes.com. All information provided is deemed reliable, but is not guaranteed to be accurate and should be independently verified.
![]() The content relating to real estate for sale in this Web site comes in part from the Internet Data eXchange (“IDX”) program of METROLIST, INC., DBA RECOLORADO®. Real estate listings held by brokers other than Ten-X are marked with the IDX Logo. This information is being provided for the consumers’ personal, non-commercial use and may not be used for any other purpose. All information subject to change and should be independently verified.
The content relating to real estate for sale in this Web site comes in part from the Internet Data eXchange (“IDX”) program of METROLIST, INC., DBA RECOLORADO®. Real estate listings held by brokers other than Ten-X are marked with the IDX Logo. This information is being provided for the consumers’ personal, non-commercial use and may not be used for any other purpose. All information subject to change and should be independently verified.
This publication is designed to provide information with regard to the subject matter covered. It is displayed with the understanding that the publisher and authors are not engaged in rendering real estate, legal, accounting, tax, or other professional services and that the publisher and authors are not offering such advice in this publication. If real estate, legal, or other expert assistance is required, the services of a competent, professional person should be sought.
The information contained in this publication is subject to change without notice. METROLIST, INC., DBA RECOLORADO MAKES NO WARRANTY OF ANY KIND WITH REGARD TO THIS MATERIAL, INCLUDING, BUT NOT LIMITED TO, THE IMPLIED WARRANTIES OF MERCHANTABILITY AND FITNESS FOR A PARTICULAR PURPOSE. METROLIST, INC., DBA RECOLORADO SHALL NOT BE LIABLE FOR ERRORS CONTAINED HEREIN OR FOR ANY DAMAGES IN CONNECTION WITH THE FURNISHING, PERFORMANCE, OR USE OF THIS MATERIAL.
PUBLISHER’S NOTICE: All real estate advertised herein is subject to the Federal Fair Housing Act and the Colorado Fair Housing Act, which Acts make it illegal to make or publish any advertisement that indicates any preference, limitation, or discrimination based on race, color, religion, sex, handicap, familial status, or national origin.
METROLIST, INC., DBA RECOLORADO will not knowingly accept any advertising for real estate that is in violation of the law. All persons are hereby informed that all dwellings advertised are available on an equal opportunity basis.
© 2025 METROLIST, INC., DBA RECOLORADO® – All Rights Reserved. 6455 S. Yosemite St., Suite 500 Greenwood Village, CO 80111 USA
ALL RIGHTS RESERVED WORLDWIDE. No part of this publication may be reproduced, adapted, translated, stored in a retrieval system or transmitted in any form or by any means, electronic, mechanical, photocopying, recording, or otherwise, without the prior written permission of the publisher. The information contained herein including but not limited to all text, photographs, digital images, virtual tours, may be seeded and monitored for protection and tracking.
- 9470 Sori Ln
- 3350 Cascina Cir Unit D
- 9566 Firenze Way
- 9452 Loggia St Unit C
- 9550 Rosato Ct
- 9487 Loggia St Unit A
- 3498 Cascina Place Unit A
- 9518 Loggia St Unit A
- 9255 Sori Ln
- 3388 Cranston Cir
- 9475 Cherryvale Dr
- 9635 Cherryvale Dr
- 3970 White Bay Dr
- 9076 Miners Place
- 9409 Prairie View Dr
- 9251 Sand Hill Trail
- 2950 Wyecliff Ln
- 9346 Lark Sparrow Dr
- 9896 Wyecliff Dr
- 2226 Thistle Ridge Cir
- 3435 Cranston Cir
- 9492 Sand Hill Place Unit Main House
- 4244 Lark Sparrow St
- 9823 Saybrook St
- 4384 Heywood Way
- 5005 Weeping Willow Cir
- 8716 Redwing Ave
- 4799 Copeland Cir Unit 204
- 4800 Copeland Cir Unit ID1045085P
- 4709 Fenwood Dr
- 4430 Copeland Lp Unit ID1045094P
- 4465 Copeland Loop Unit 201
- 8470 S Little Rock Way Unit 101
- 5253 Wangaratta Way
- 4569 Copeland Loop Unit 101
- 4927 Tarcoola Ln
- 4644 Copeland Loop
- 3380 E County Line Rd
- 10297 Greatwood Pointe
- 8305 S Harvest Ln