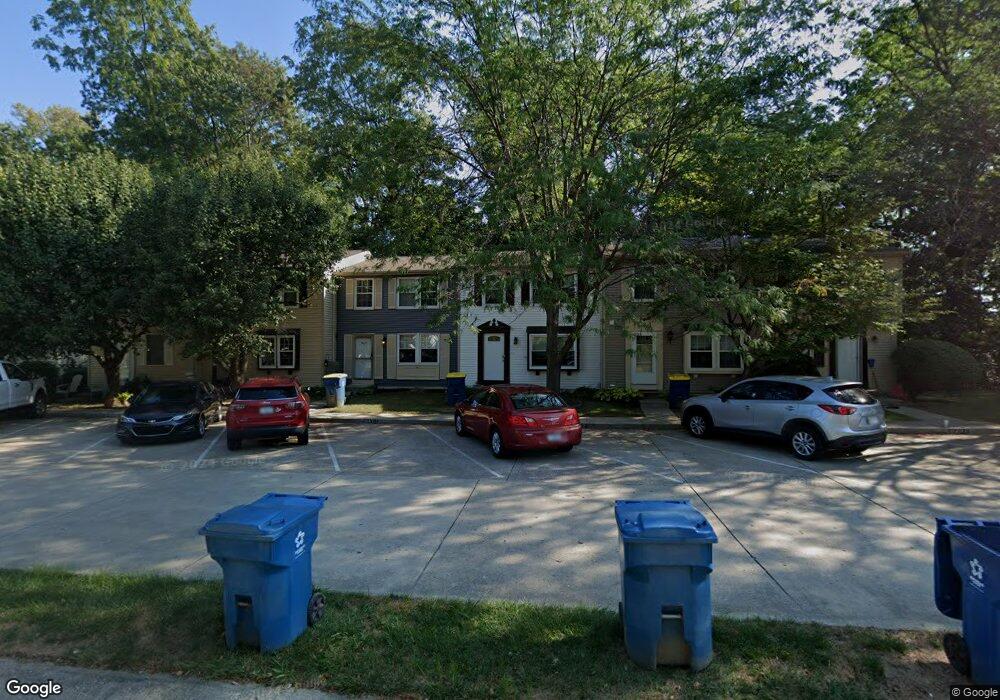
9475 Timber View Dr Unit 8 Indianapolis, IN 46250
Castleton NeighborhoodEstimated Value: $176,780 - $215,000
3
Beds
2
Baths
1,640
Sq Ft
$120/Sq Ft
Est. Value
About This Home
This home is located at 9475 Timber View Dr Unit 8, Indianapolis, IN 46250 and is currently estimated at $197,195, approximately $120 per square foot. 9475 Timber View Dr Unit 8 is a home located in Marion County with nearby schools including Mary Evelyn Castle Elementary School, Belzer Middle School, and Lawrence Central High School.
Ownership History
Date
Name
Owned For
Owner Type
Purchase Details
Closed on
Aug 10, 2023
Sold by
Beher Kevin
Bought by
Ktb Rentals Llc-S Series 11
Current Estimated Value
Purchase Details
Closed on
Aug 2, 2023
Sold by
Beher Kevin
Bought by
Ktb Rentals Llc-S Series 11
Purchase Details
Closed on
Aug 26, 2020
Sold by
Dewar Marecia
Bought by
Beher Kevin
Purchase Details
Closed on
Jul 26, 2013
Sold by
Busch A M A and Busch M A
Bought by
Dewar Marecia and Dewar D
Home Financials for this Owner
Home Financials are based on the most recent Mortgage that was taken out on this home.
Original Mortgage
$2,840
Interest Rate
3.93%
Purchase Details
Closed on
Jul 8, 2013
Sold by
Busch A Monique
Bought by
Dewar Marecia
Home Financials for this Owner
Home Financials are based on the most recent Mortgage that was taken out on this home.
Original Mortgage
$2,840
Interest Rate
3.93%
Create a Home Valuation Report for This Property
The Home Valuation Report is an in-depth analysis detailing your home's value as well as a comparison with similar homes in the area
Home Values in the Area
Average Home Value in this Area
Purchase History
| Date | Buyer | Sale Price | Title Company |
|---|---|---|---|
| Ktb Rentals Llc-S Series 11 | -- | Title Alliance | |
| Ktb Rentals Llc-S Series 11 | -- | Title Alliance | |
| Beher Kevin | $138,500 | Centurion Land Title | |
| Dewar Marecia | -- | -- | |
| Dewar Marecia | $71,000 | -- |
Source: Public Records
Mortgage History
| Date | Status | Borrower | Loan Amount |
|---|---|---|---|
| Previous Owner | Dewar Marecia | $2,840 | |
| Previous Owner | Dewar Marecia | $69,714 |
Source: Public Records
Tax History Compared to Growth
Tax History
| Year | Tax Paid | Tax Assessment Tax Assessment Total Assessment is a certain percentage of the fair market value that is determined by local assessors to be the total taxable value of land and additions on the property. | Land | Improvement |
|---|---|---|---|---|
| 2024 | $3,381 | $153,400 | $7,900 | $145,500 |
| 2023 | $3,381 | $152,300 | $7,900 | $144,400 |
| 2022 | $3,285 | $146,600 | $7,900 | $138,700 |
| 2021 | $2,950 | $129,700 | $7,900 | $121,800 |
| 2020 | $883 | $96,700 | $7,900 | $88,800 |
| 2019 | $722 | $91,400 | $7,900 | $83,500 |
| 2018 | $664 | $87,400 | $7,900 | $79,500 |
| 2017 | $523 | $78,300 | $7,900 | $70,400 |
| 2016 | $467 | $74,900 | $7,900 | $67,000 |
| 2014 | $370 | $72,900 | $7,900 | $65,000 |
| 2013 | $483 | $80,200 | $7,900 | $72,300 |
Source: Public Records
Map
Nearby Homes
- 9375 Timber View Dr
- 9503 Bent Brook Dr
- 9560 Bay Vista Dr E
- 6126 E 96th Place
- 9593 Bay Vista Dr W
- 9584 Bay Vista East Dr
- 6370 Bayside Ct
- 6368 Bayside Ct
- 6416 Behner Reach
- 6070 Southbay Dr
- 6058 Southbay Dr
- 6454 Watham Ct
- 6047 Southbay Dr
- 6018 Southbay Dr
- 9123 Behner Brook Dr
- 9716 Spruce Ln
- 6533 Aintree Place
- 9517 Aberdare Dr
- 9828 Pine Ridge Dr N
- 0 E 96th St Unit MBR22029517
- 9475 Timber View Dr
- 9475 Timber View Dr Unit BLK 8
- 9473 Timber View Dr
- 9477 Timber View Dr
- 9479 Timber View Dr
- 9471 Timber View Dr
- 9471 Timber View Dr
- 9481 Timber View Dr
- 9461 Timber View Dr
- 9461 Timber View Dr
- 9489 Timber View Dr
- 9459 Timber View Dr
- 9491 Timber View Dr
- 9457 Timber View Dr
- 9461 Aspen Grove Ln
- 9495 Timber View Dr
- 9455 Timber View Dr
- 9455 Timber View Dr Unit Block 22
- 9455 Timber View Dr Unit 9455
- 9459 Aspen Grove Ln