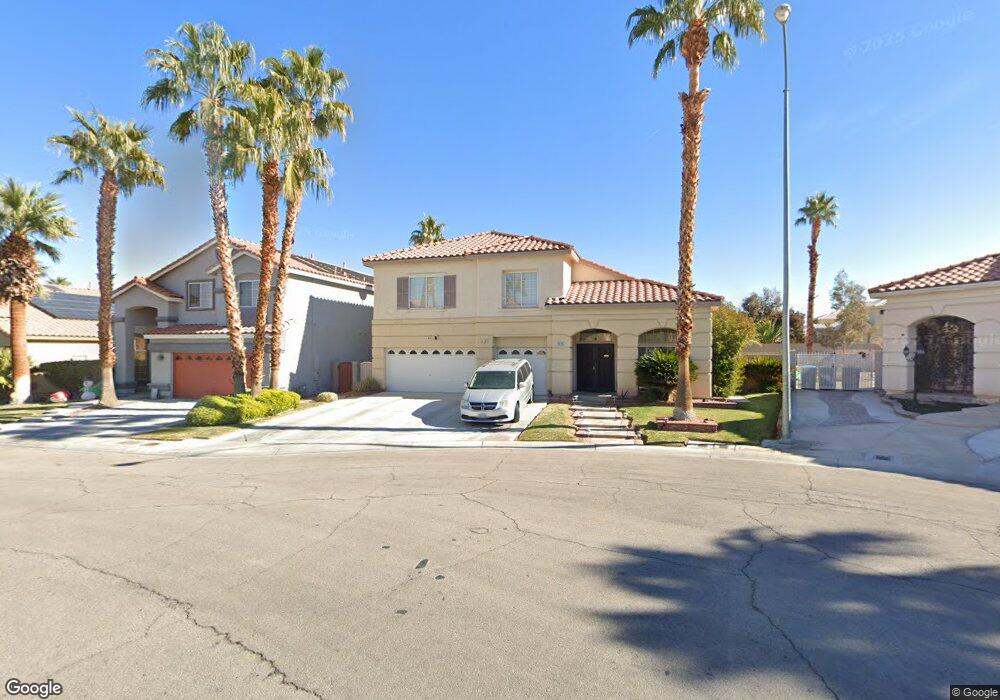
9478 Lugo St Las Vegas, NV 89123
Silverado Ranch NeighborhoodEstimated Value: $611,000 - $658,000
4
Beds
3
Baths
3,203
Sq Ft
$200/Sq Ft
Est. Value
About This Home
This home is located at 9478 Lugo St, Las Vegas, NV 89123 and is currently estimated at $640,041, approximately $199 per square foot. 9478 Lugo St is a home located in Clark County with nearby schools including Roberta C Cartwright Elementary School, Charles Silvestri Junior High School, and Silverado High School.
Ownership History
Date
Name
Owned For
Owner Type
Purchase Details
Closed on
Sep 12, 2017
Sold by
Blaufuss Elizabeth
Bought by
Blafuss Elizabeth Maria
Current Estimated Value
Purchase Details
Closed on
Oct 13, 2003
Sold by
Crisafulli Adam
Bought by
Blaufuss Lisa and Blaufuss Elizabeth
Purchase Details
Closed on
Apr 3, 2000
Sold by
Correl Kevin and Correll Jan E
Bought by
Crisafulli Adam
Home Financials for this Owner
Home Financials are based on the most recent Mortgage that was taken out on this home.
Original Mortgage
$215,975
Interest Rate
4.95%
Purchase Details
Closed on
Mar 5, 1998
Sold by
Astoria Verona Ltd Partnership
Bought by
Correll Kevin and Correll Jan E
Home Financials for this Owner
Home Financials are based on the most recent Mortgage that was taken out on this home.
Original Mortgage
$185,250
Interest Rate
6.99%
Create a Home Valuation Report for This Property
The Home Valuation Report is an in-depth analysis detailing your home's value as well as a comparison with similar homes in the area
Home Values in the Area
Average Home Value in this Area
Purchase History
| Date | Buyer | Sale Price | Title Company |
|---|---|---|---|
| Blafuss Elizabeth Maria | -- | None Available | |
| Blaufuss Lisa | $310,000 | Land Title Of Nevada | |
| Crisafulli Adam | $240,000 | Fidelity National Title | |
| Correll Kevin | $195,500 | United Title |
Source: Public Records
Mortgage History
| Date | Status | Borrower | Loan Amount |
|---|---|---|---|
| Previous Owner | Crisafulli Adam | $215,975 | |
| Previous Owner | Correll Kevin | $185,250 |
Source: Public Records
Tax History Compared to Growth
Tax History
| Year | Tax Paid | Tax Assessment Tax Assessment Total Assessment is a certain percentage of the fair market value that is determined by local assessors to be the total taxable value of land and additions on the property. | Land | Improvement |
|---|---|---|---|---|
| 2025 | $2,883 | $162,058 | $49,000 | $113,058 |
| 2024 | $2,799 | $162,058 | $49,000 | $113,058 |
| 2023 | $2,799 | $152,997 | $45,500 | $107,497 |
| 2022 | $2,718 | $140,241 | $42,000 | $98,241 |
| 2021 | $2,639 | $125,389 | $31,850 | $93,539 |
| 2020 | $2,559 | $124,642 | $31,850 | $92,792 |
| 2019 | $2,485 | $120,339 | $28,700 | $91,639 |
| 2018 | $2,412 | $111,628 | $23,800 | $87,828 |
| 2017 | $3,185 | $108,591 | $23,800 | $84,791 |
| 2016 | $2,284 | $100,748 | $17,150 | $83,598 |
| 2015 | $2,280 | $88,256 | $15,400 | $72,856 |
| 2014 | $2,209 | $73,073 | $7,000 | $66,073 |
Source: Public Records
Map
Nearby Homes
- 1905 Bocale Ct
- 9560 Summerfest St
- 1945 Bova Matrina Ct
- 9620 Orchid Bay Dr
- 2195 Merano Ct
- 2216 Madica Ave
- 1846 Autumn Gold Ave
- 1647 Silver Knoll Ave
- 1704 Silver Point Ave
- 2196 Pescara Ct
- 2300 E Silverado Ranch Blvd Unit 2112
- 2300 E Silverado Ranch Blvd Unit 2033
- 2300 E Silverado Ranch Blvd Unit 2161
- 2300 E Silverado Ranch Blvd Unit 1080
- 2300 E Silverado Ranch Blvd Unit 1106
- 2300 E Silverado Ranch Blvd Unit 2196
- 2300 E Silverado Ranch Blvd Unit 2158
- 2300 E Silverado Ranch Blvd Unit 1074
- 2300 E Silverado Ranch Blvd Unit 1180
- 2300 E Silverado Ranch Blvd Unit 1104
- 9468 Lugo St
- 1983 Parma Ave
- 9458 Lugo St
- 2026 Paterno Ave
- 1967 Parma Ave
- 1967 Parma Ave Unit n/a
- 9465 Lugo St Unit 3
- 2025 Paterno Ave Unit 4
- 9448 Lugo St
- 9461 Lugo St
- 2038 Paterno Ave
- 2025 Madica Ave
- 1951 Parma Ave
- 2037 Paterno Ave
- 9451 Lugo St
- 9438 Lugo St
- 2037 Madica Ave
- 1936 Parma Ave
- 2050 Paterno Ave
- 1935 Parma Ave