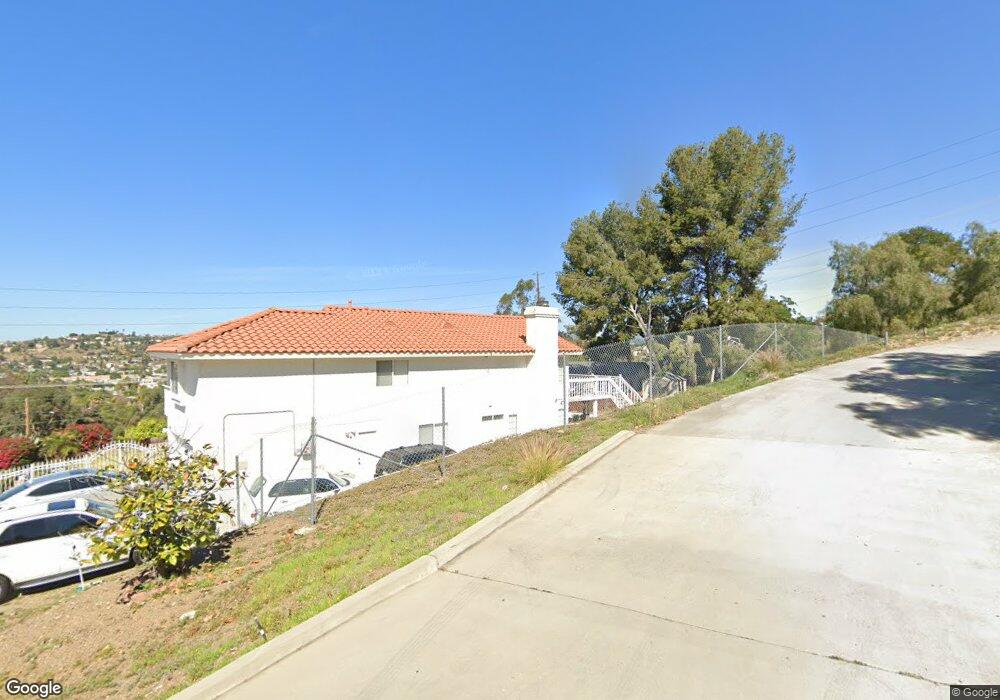
9478 Spring View St Spring Valley, CA 91977
Estimated Value: $963,000 - $1,025,510
4
Beds
3
Baths
2,435
Sq Ft
$407/Sq Ft
Est. Value
About This Home
This home is located at 9478 Spring View St, Spring Valley, CA 91977 and is currently estimated at $991,628, approximately $407 per square foot. 9478 Spring View St is a home located in San Diego County with nearby schools including Spring Valley Middle School, Highlands Elementary School, and Monte Vista High School.
Ownership History
Date
Name
Owned For
Owner Type
Purchase Details
Closed on
Jan 5, 2024
Sold by
Dodge Southern Melvin and Ector Southern Ardellia
Bought by
Southern Family Trust
Current Estimated Value
Purchase Details
Closed on
Dec 9, 1998
Sold by
Carl Meram
Bought by
Southern Melvin D and Southern Ardellia W
Home Financials for this Owner
Home Financials are based on the most recent Mortgage that was taken out on this home.
Original Mortgage
$199,200
Interest Rate
6.91%
Create a Home Valuation Report for This Property
The Home Valuation Report is an in-depth analysis detailing your home's value as well as a comparison with similar homes in the area
Home Values in the Area
Average Home Value in this Area
Purchase History
| Date | Buyer | Sale Price | Title Company |
|---|---|---|---|
| Southern Family Trust | -- | None Listed On Document | |
| Southern Melvin D | $249,000 | Stewart Title |
Source: Public Records
Mortgage History
| Date | Status | Borrower | Loan Amount |
|---|---|---|---|
| Previous Owner | Southern Melvin D | $199,200 |
Source: Public Records
Tax History
| Year | Tax Paid | Tax Assessment Tax Assessment Total Assessment is a certain percentage of the fair market value that is determined by local assessors to be the total taxable value of land and additions on the property. | Land | Improvement |
|---|---|---|---|---|
| 2025 | $5,053 | $390,330 | $93,060 | $297,270 |
| 2024 | $5,053 | $382,678 | $91,236 | $291,442 |
| 2023 | $4,893 | $375,176 | $89,448 | $285,728 |
| 2022 | $4,812 | $367,821 | $87,695 | $280,126 |
| 2021 | $4,764 | $360,610 | $85,976 | $274,634 |
| 2020 | $4,574 | $356,913 | $85,095 | $271,818 |
| 2019 | $4,505 | $349,916 | $83,427 | $266,489 |
| 2018 | $4,371 | $343,056 | $81,792 | $261,264 |
| 2017 | $4,268 | $336,331 | $80,189 | $256,142 |
| 2016 | $4,110 | $329,737 | $78,617 | $251,120 |
| 2015 | $4,077 | $324,785 | $77,437 | $247,348 |
| 2014 | $4,001 | $318,424 | $75,921 | $242,503 |
Source: Public Records
Map
Nearby Homes
- 9356 1 2 Lamar St
- 9380 Francis Dr
- 3404 Helix St
- 3557 Kenora Dr Unit 41
- 3557 Kenora Dr Unit 22
- 3557 Kenora Dr Unit 6
- 2820 Highlands Blvd
- 00 Helix St Unit 237
- 9309 Hillside Dr
- 2840 Helix St
- 9034 Kenwood Dr Unit 10
- 3821-23 Rogers Ln
- 3365 S Bonita St
- 9126 Valencia St
- 9860 Dale Ave Unit C12
- 9860 Dale Ave Unit D7
- 9860 Dale Ave Unit B9
- 9860 Dale Ave Unit D10
- 9306 Hollyhock Ln
- 9869 Aldergrove Ln
Your Personal Tour Guide
Ask me questions while you tour the home.