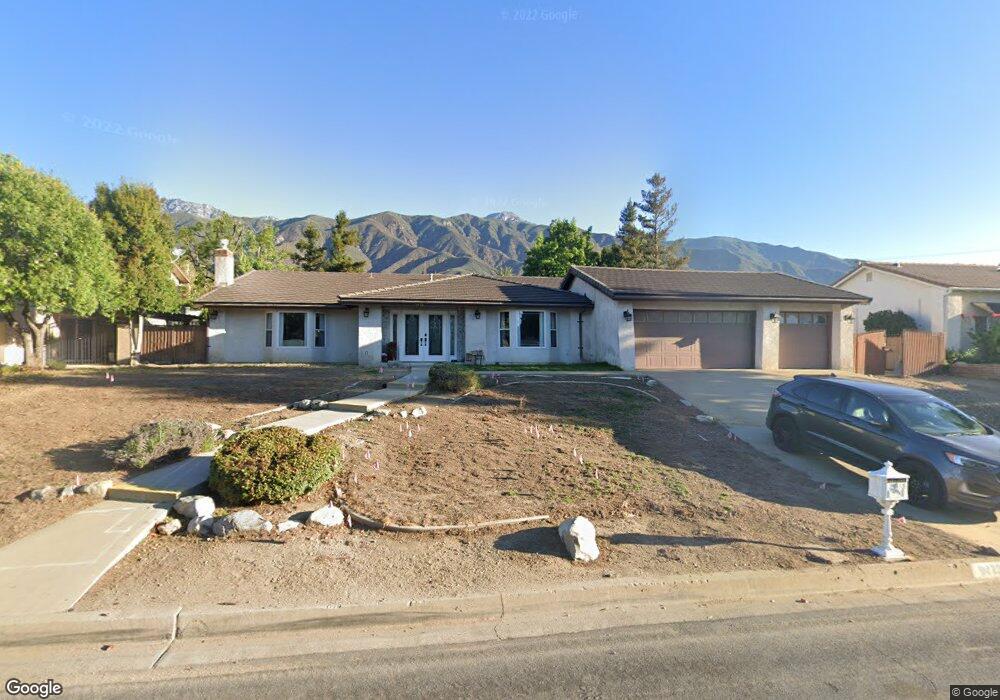
9478 Valley View St Rancho Cucamonga, CA 91737
Estimated Value: $1,108,335 - $1,424,000
4
Beds
2
Baths
2,966
Sq Ft
$431/Sq Ft
Est. Value
About This Home
This home is located at 9478 Valley View St, Rancho Cucamonga, CA 91737 and is currently estimated at $1,278,334, approximately $430 per square foot. 9478 Valley View St is a home located in San Bernardino County with nearby schools including Floyd M. Stork Elementary, Alta Loma Junior High, and Los Osos High.
Ownership History
Date
Name
Owned For
Owner Type
Purchase Details
Closed on
Mar 5, 2014
Sold by
Marchisset Roger and Marchisset Lucienne
Bought by
Mcclintock Claudine M
Current Estimated Value
Home Financials for this Owner
Home Financials are based on the most recent Mortgage that was taken out on this home.
Original Mortgage
$402,000
Outstanding Balance
$304,122
Interest Rate
4.29%
Mortgage Type
New Conventional
Estimated Equity
$974,212
Purchase Details
Closed on
Aug 28, 2006
Sold by
Mcclintock Claudine M
Bought by
Mcclintock Claudine M and Marchisset Roger
Purchase Details
Closed on
Mar 28, 2001
Sold by
Conklin Chris G
Bought by
Mcclintock Claudine M
Home Financials for this Owner
Home Financials are based on the most recent Mortgage that was taken out on this home.
Original Mortgage
$210,000
Interest Rate
7.19%
Purchase Details
Closed on
Dec 8, 1994
Sold by
Mcclintock Claudine M
Bought by
Mcclintock Claudine M and Conklin Chris G
Create a Home Valuation Report for This Property
The Home Valuation Report is an in-depth analysis detailing your home's value as well as a comparison with similar homes in the area
Home Values in the Area
Average Home Value in this Area
Purchase History
| Date | Buyer | Sale Price | Title Company |
|---|---|---|---|
| Mcclintock Claudine M | -- | American Coast Title Co | |
| Mcclintock Claudine M | -- | Accommodation | |
| Mcclintock Claudine M | -- | Commonwealth Land Title | |
| Mcclintock Claudine M | -- | Old Republic Title Company |
Source: Public Records
Mortgage History
| Date | Status | Borrower | Loan Amount |
|---|---|---|---|
| Open | Mcclintock Claudine M | $402,000 | |
| Closed | Mcclintock Claudine M | $210,000 |
Source: Public Records
Tax History Compared to Growth
Tax History
| Year | Tax Paid | Tax Assessment Tax Assessment Total Assessment is a certain percentage of the fair market value that is determined by local assessors to be the total taxable value of land and additions on the property. | Land | Improvement |
|---|---|---|---|---|
| 2025 | $5,958 | $543,599 | $144,238 | $399,361 |
| 2024 | $5,958 | $532,940 | $141,410 | $391,530 |
| 2023 | $5,825 | $522,490 | $138,637 | $383,853 |
| 2022 | $5,810 | $512,245 | $135,919 | $376,326 |
| 2021 | $5,806 | $502,201 | $133,254 | $368,947 |
| 2020 | $5,572 | $497,052 | $131,888 | $365,164 |
| 2019 | $5,633 | $487,306 | $129,302 | $358,004 |
| 2018 | $5,509 | $477,751 | $126,767 | $350,984 |
| 2017 | $5,263 | $468,383 | $124,281 | $344,102 |
| 2016 | $5,122 | $459,199 | $121,844 | $337,355 |
| 2015 | $5,090 | $507,016 | $176,557 | $330,459 |
| 2014 | $4,949 | $443,442 | $117,663 | $325,779 |
Source: Public Records
Map
Nearby Homes
- 9609 Norbrook Dr
- 9655 Norbrook Dr
- 9239 Camellia Ct
- 9227 Camellia Ct
- 9230 Camellia Ct
- 9220 Camellia Ct
- 9210 Camellia Ct
- 9209 Camellia Ct
- 9201 Camellia Ct
- 9179 Hidden Farm Rd
- 5338 Falling Tree Ln
- 8967 Citation Ct
- 9066 Laramie Dr
- 5330 Evening Canyon Way
- 8915 Appaloosa Ct
- 9513 Sunflower St
- 6055 Amethyst Ave
- 8911 Mustang Rd
- 8798 Justify Dr
- 5885 Zapata Place
- 9462 Valley View St
- 9494 Valley View St
- 9465 Stanford Dr
- 9487 Stanford Dr
- 9446 Valley View St
- 9477 Valley View St
- 9445 Stanford Dr
- 9493 Valley View St
- 9461 Valley View St
- 5353 Amethyst St
- 9445 Valley View St
- 5377 Amethyst St
- 9462 Stanford Dr
- 9482 Stanford Dr
- 9425 Stanford Dr
- 5333 Amethyst St
- 9440 Stanford Dr
- 5423 Amethyst St
- 9429 Valley View St
- 9416 Valley View St