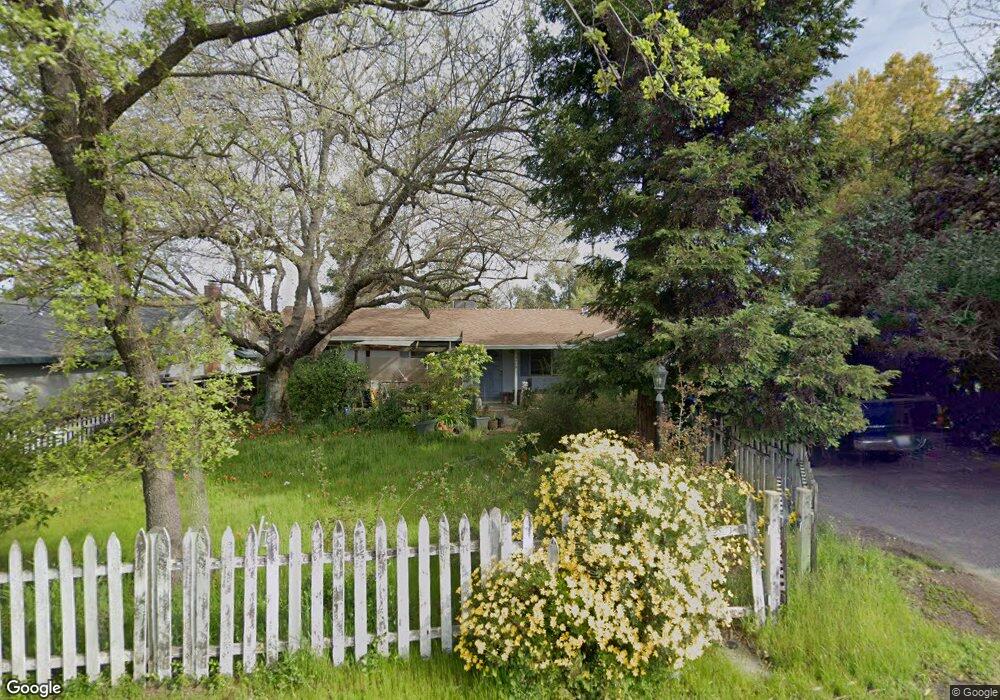
9479 Vallejo Dr Orangevale, CA 95662
Estimated Value: $574,000 - $639,984
3
Beds
2
Baths
2,248
Sq Ft
$273/Sq Ft
Est. Value
About This Home
This home is located at 9479 Vallejo Dr, Orangevale, CA 95662 and is currently estimated at $614,746, approximately $273 per square foot. 9479 Vallejo Dr is a home located in Sacramento County with nearby schools including Ottomon Way Elementary School, Louis Pasteur Fundamental Middle School, and Casa Roble Fundamental High School.
Ownership History
Date
Name
Owned For
Owner Type
Purchase Details
Closed on
Apr 17, 2003
Sold by
Burr Prewitt Janet
Bought by
Burr Prewitt Janet
Current Estimated Value
Home Financials for this Owner
Home Financials are based on the most recent Mortgage that was taken out on this home.
Original Mortgage
$261,000
Outstanding Balance
$125,321
Interest Rate
7.37%
Estimated Equity
$489,425
Purchase Details
Closed on
Jul 18, 2000
Sold by
Burr Prewitt Janet
Bought by
Burr Prewitt Janet
Home Financials for this Owner
Home Financials are based on the most recent Mortgage that was taken out on this home.
Original Mortgage
$11,000
Interest Rate
8.16%
Mortgage Type
Credit Line Revolving
Purchase Details
Closed on
Jul 21, 1995
Sold by
Ahlers Marvin G and Ahlers Sandra J
Bought by
Burr Prewitt Janet
Home Financials for this Owner
Home Financials are based on the most recent Mortgage that was taken out on this home.
Original Mortgage
$128,835
Interest Rate
7.61%
Mortgage Type
FHA
Create a Home Valuation Report for This Property
The Home Valuation Report is an in-depth analysis detailing your home's value as well as a comparison with similar homes in the area
Home Values in the Area
Average Home Value in this Area
Purchase History
| Date | Buyer | Sale Price | Title Company |
|---|---|---|---|
| Burr Prewitt Janet | -- | New Century Title | |
| Burr Prewitt Janet | -- | Fidelity National Title Co | |
| Burr Prewitt Janet | $131,000 | Chicago Title Co |
Source: Public Records
Mortgage History
| Date | Status | Borrower | Loan Amount |
|---|---|---|---|
| Open | Burr Prewitt Janet | $261,000 | |
| Closed | Burr Prewitt Janet | $11,000 | |
| Previous Owner | Burr Prewitt Janet | $128,835 |
Source: Public Records
Tax History
| Year | Tax Paid | Tax Assessment Tax Assessment Total Assessment is a certain percentage of the fair market value that is determined by local assessors to be the total taxable value of land and additions on the property. | Land | Improvement |
|---|---|---|---|---|
| 2025 | $8,225 | $270,201 | $53,142 | $217,059 |
| 2024 | $8,225 | $264,903 | $52,100 | $212,803 |
| 2023 | $3,061 | $259,710 | $51,079 | $208,631 |
| 2022 | $3,044 | $254,619 | $50,078 | $204,541 |
| 2021 | $2,999 | $249,628 | $49,097 | $200,531 |
| 2020 | $2,943 | $247,069 | $48,594 | $198,475 |
| 2019 | $2,883 | $242,226 | $47,642 | $194,584 |
| 2018 | $2,849 | $237,477 | $46,708 | $190,769 |
| 2017 | $2,820 | $232,822 | $45,793 | $187,029 |
| 2016 | $2,635 | $228,258 | $44,896 | $183,362 |
| 2015 | $2,590 | $224,830 | $44,222 | $180,608 |
| 2014 | $2,535 | $220,427 | $43,356 | $177,071 |
Source: Public Records
Map
Nearby Homes
- 6715 Main Ave
- 120 Puffer Way
- 117 Oak Rock Cir
- 118 S Fork Way
- 224 Oak Canyon Way
- 6412 Benning St Unit 5B
- 104 Winding Canyon Ln
- 124 Winding Canyon Ln
- 144 Gold Creek Cir
- 116 Raeanne Ln
- 9340 Orangevale Ave Unit 26
- 9340 Orangevale Ave Unit 27
- 7314 Santa Juanita Ave
- 6805 Chestnut Ave
- 7400 Mountain Ave
- 284 Marsalla Dr
- 279 Marsalla Dr
- 7330 Saint John Way
- 6132 Main Ave Unit 43
- 7545 Cardwell Ave
- 9475 Vallejo Dr
- 9487 Vallejo Dr
- 9471 Vallejo Dr
- 9476 Vallejo Dr
- 9470 Vallejo Dr
- 9467 Vallejo Dr
- 9497 Vallejo Dr
- 9494 Vallejo Dr
- 6816 Casten Ln
- 6825 Rock Ranch Dr
- 9463 Vallejo Dr
- 6822 Rock Ranch Dr
- 9498 Vallejo Dr
- 9501 Vallejo Dr
- 9488 Vallejo Dr
- 9460 Vallejo Dr
- 6717 Wyatt Ln
- 9457 Casten Ln
- 9445 Vallejo Dr
- 9450 Vallejo Dr
Your Personal Tour Guide
Ask me questions while you tour the home.