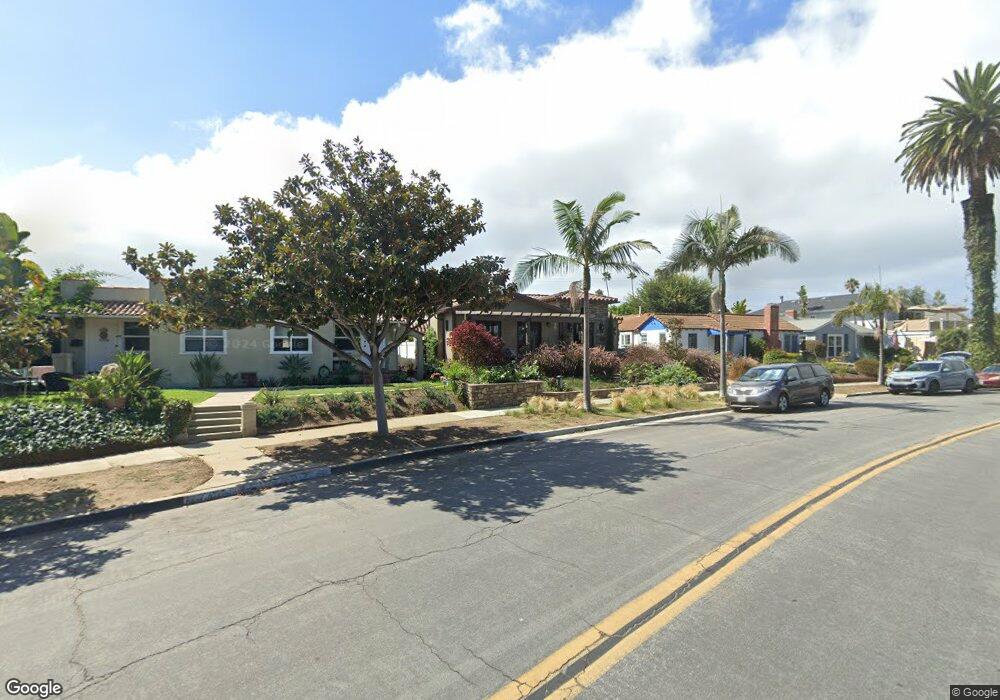
948 11th St Huntington Beach, CA 92648
Estimated Value: $1,773,000 - $2,071,000
2
Beds
2
Baths
1,599
Sq Ft
$1,170/Sq Ft
Est. Value
About This Home
This home is located at 948 11th St, Huntington Beach, CA 92648 and is currently estimated at $1,871,234, approximately $1,170 per square foot. 948 11th St is a home located in Orange County with nearby schools including Agnes L. Smith Elementary, Ethel Dwyer Middle, and Huntington Beach High School.
Ownership History
Date
Name
Owned For
Owner Type
Purchase Details
Closed on
May 31, 2024
Sold by
Meyer James
Bought by
Mekis-Meyer Jayme L
Current Estimated Value
Purchase Details
Closed on
Aug 28, 2019
Sold by
Mekis Jayme L and Meyer James
Bought by
Meyer James and Mekis Jayme L
Home Financials for this Owner
Home Financials are based on the most recent Mortgage that was taken out on this home.
Original Mortgage
$450,000
Interest Rate
3.8%
Mortgage Type
New Conventional
Purchase Details
Closed on
Nov 22, 2017
Sold by
Chapman Shari D and Meyer Jayme L Mekis
Bought by
Meyer Jayme L Mekis and Meyer Jim
Purchase Details
Closed on
Feb 24, 1995
Sold by
Stovall Horace C and Stovall Renee E
Bought by
Stovall Horace C and Stovall Renee E
Create a Home Valuation Report for This Property
The Home Valuation Report is an in-depth analysis detailing your home's value as well as a comparison with similar homes in the area
Home Values in the Area
Average Home Value in this Area
Purchase History
| Date | Buyer | Sale Price | Title Company |
|---|---|---|---|
| Mekis-Meyer Jayme L | -- | None Listed On Document | |
| Meyer James | -- | Old Republic Title Company | |
| Meyer Jayme L Mekis | -- | None Available | |
| Stovall Horace C | -- | -- | |
| Stovall Horace C | -- | -- | |
| Stovall Horace C | -- | -- | |
| Stovall Horace C | -- | -- | |
| Stovall Horace C | -- | -- | |
| Stovall Horace C | -- | -- |
Source: Public Records
Mortgage History
| Date | Status | Borrower | Loan Amount |
|---|---|---|---|
| Previous Owner | Meyer James | $450,000 |
Source: Public Records
Tax History Compared to Growth
Tax History
| Year | Tax Paid | Tax Assessment Tax Assessment Total Assessment is a certain percentage of the fair market value that is determined by local assessors to be the total taxable value of land and additions on the property. | Land | Improvement |
|---|---|---|---|---|
| 2025 | $12,207 | $1,085,016 | $36,777 | $1,048,239 |
| 2024 | $12,207 | $1,063,742 | $36,056 | $1,027,686 |
| 2023 | $11,995 | $1,042,885 | $35,349 | $1,007,536 |
| 2022 | $11,681 | $1,022,437 | $34,656 | $987,781 |
| 2021 | $3,571 | $280,759 | $33,977 | $246,782 |
| 2020 | $1,509 | $92,419 | $33,629 | $58,790 |
| 2019 | $1,361 | $90,607 | $32,969 | $57,638 |
| 2018 | $1,341 | $88,831 | $32,323 | $56,508 |
| 2017 | $1,245 | $87,090 | $31,690 | $55,400 |
| 2016 | $1,199 | $85,383 | $31,069 | $54,314 |
| 2015 | $1,184 | $84,101 | $30,602 | $53,499 |
| 2014 | $1,158 | $82,454 | $30,002 | $52,452 |
Source: Public Records
Map
Nearby Homes
- 949 10th St
- 945 10th St
- 204 Lincoln Ave
- 203 Indianapolis Ave
- 1208 California St
- 704 Lake St Unit 61
- 1216 California St
- 1102 Park St
- 208 Indianapolis Ave
- 1112 Park St
- 1017 Delaware St
- 219 Portland Ave
- 621 8th St
- 344 Portland Cir Unit 342
- 118 Adams Ave
- 1701 Lake St
- 402 Indianapolis Ave
- 1425 Alpine Ln
- 620 Huntington St
- 526 12th St