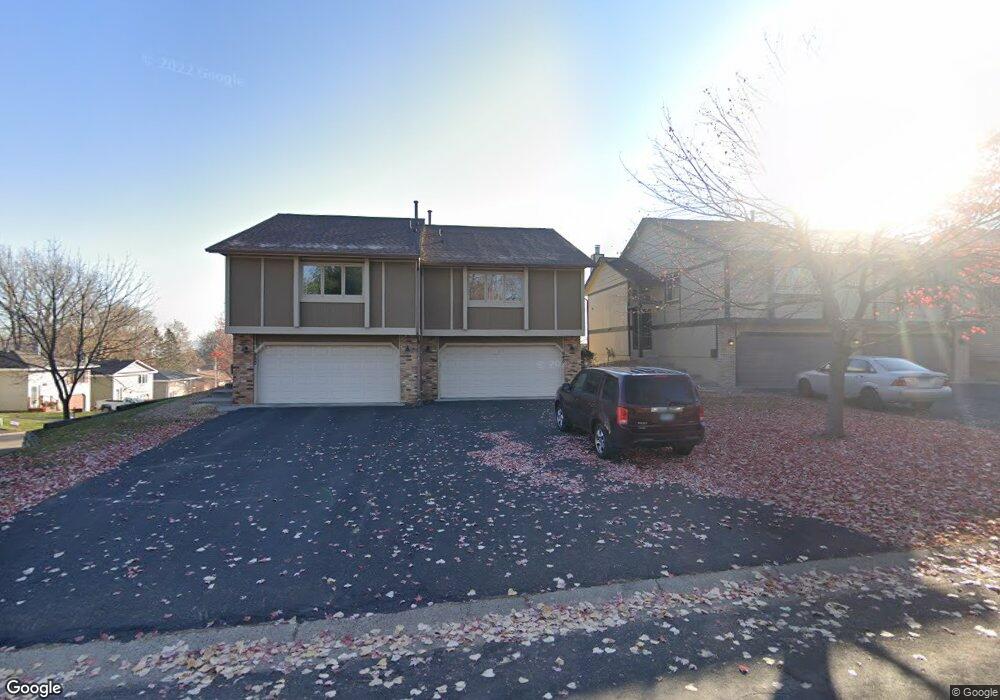
948 18th Ave N South Saint Paul, MN 55075
Estimated Value: $255,000 - $273,000
3
Beds
3
Baths
1,581
Sq Ft
$166/Sq Ft
Est. Value
About This Home
This home is located at 948 18th Ave N, South Saint Paul, MN 55075 and is currently estimated at $262,916, approximately $166 per square foot. 948 18th Ave N is a home located in Dakota County with nearby schools including Lincoln Center Elementary, South St. Paul Secondary, and Academic Arts High School.
Ownership History
Date
Name
Owned For
Owner Type
Purchase Details
Closed on
Jul 12, 2021
Sold by
Ehlenfeldt Blair and Ehlenfeldt Sara
Bought by
Ongeri Robert N
Current Estimated Value
Home Financials for this Owner
Home Financials are based on the most recent Mortgage that was taken out on this home.
Original Mortgage
$251,363
Outstanding Balance
$228,420
Interest Rate
3%
Mortgage Type
FHA
Estimated Equity
$34,496
Purchase Details
Closed on
Aug 28, 2015
Sold by
Casavant Brent J and Casavant Angie
Bought by
Ehlenfeldt Blair and Ehlenfeldt Sara
Home Financials for this Owner
Home Financials are based on the most recent Mortgage that was taken out on this home.
Original Mortgage
$6,000
Interest Rate
3.97%
Mortgage Type
Stand Alone Second
Purchase Details
Closed on
Jun 14, 2002
Sold by
Keopp Jeffrey R and Keopp Xiomara
Bought by
Casavant Brent J
Purchase Details
Closed on
Jul 25, 1997
Sold by
Schmidt Helen E
Bought by
Keopp Jeffrey R
Create a Home Valuation Report for This Property
The Home Valuation Report is an in-depth analysis detailing your home's value as well as a comparison with similar homes in the area
Home Values in the Area
Average Home Value in this Area
Purchase History
| Date | Buyer | Sale Price | Title Company |
|---|---|---|---|
| Ongeri Robert N | $256,000 | Edgewater Title Group Llc | |
| Ehlenfeldt Blair | $142,500 | Burnet Title | |
| Casavant Brent J | $152,900 | -- | |
| Keopp Jeffrey R | $87,500 | -- | |
| Ongeri Robert Robert | $256,000 | -- |
Source: Public Records
Mortgage History
| Date | Status | Borrower | Loan Amount |
|---|---|---|---|
| Open | Ongeri Robert N | $251,363 | |
| Previous Owner | Ehlenfeldt Blair | $6,000 | |
| Previous Owner | Ehlenfeldt Blair | $139,350 | |
| Closed | Ongeri Robert Robert | $251,363 |
Source: Public Records
Tax History Compared to Growth
Tax History
| Year | Tax Paid | Tax Assessment Tax Assessment Total Assessment is a certain percentage of the fair market value that is determined by local assessors to be the total taxable value of land and additions on the property. | Land | Improvement |
|---|---|---|---|---|
| 2024 | $3,592 | $239,600 | $31,500 | $208,100 |
| 2023 | $3,592 | $238,900 | $31,700 | $207,200 |
| 2022 | $2,648 | $244,200 | $31,700 | $212,500 |
| 2021 | $2,454 | $206,500 | $27,500 | $179,000 |
| 2020 | $2,128 | $190,100 | $26,200 | $163,900 |
| 2019 | $2,000 | $172,300 | $25,000 | $147,300 |
| 2018 | $1,808 | $157,800 | $23,300 | $134,500 |
| 2017 | $1,547 | $140,200 | $21,600 | $118,600 |
| 2016 | $1,524 | $127,000 | $19,700 | $107,300 |
| 2015 | $1,484 | $94,868 | $14,637 | $80,231 |
| 2014 | -- | $98,247 | $14,781 | $83,466 |
| 2013 | -- | $93,560 | $13,098 | $80,462 |
Source: Public Records
Map
Nearby Homes
- 921 17th Ave N
- 1044 17th Ave N
- 818 16th Ave N
- 1010 Summit Ave
- 621 17th Ave N
- 601 Levander Way Unit 101
- 601 Levander Way Unit 208
- 606 13th Ave N
- 522 16th Ave N
- 1365 Christensen Ave
- 1200 Dwane St
- 436 17th Ave N
- 425 16th Ave N
- 1560 Stickney Ave
- 2205 Acorn Ln
- 1439 Oakdale Ave
- 518 8th Ave N
- 1616 Stickney Ave
- 351 12th Ave N
- 352 12th Ave N
- 946 18th Ave N
- 950 18th Ave N
- 944 18th Ave N
- 944 944 18th Ave N
- 1711 Hawley Ave
- 942 18th Ave N
- 1709 Hawley Ave
- 1709 Hawley Ave Unit 1709
- 940 18th Ave N
- 938 18th Ave N
- 943 17th Ave N
- 947 17th Ave N
- 949 17th Ave N
- 941 17th Ave N
- 1720 Hawley Ave
- 1724 Hawley Ave
- 947 18th Ave N
- 936 18th Ave N
- 1716 1716 Hawley-Avenue-
- 936 936 18th Ave N